Why Bitcoin (BTC)’s Parabolic Rally May Not Be Over Yet
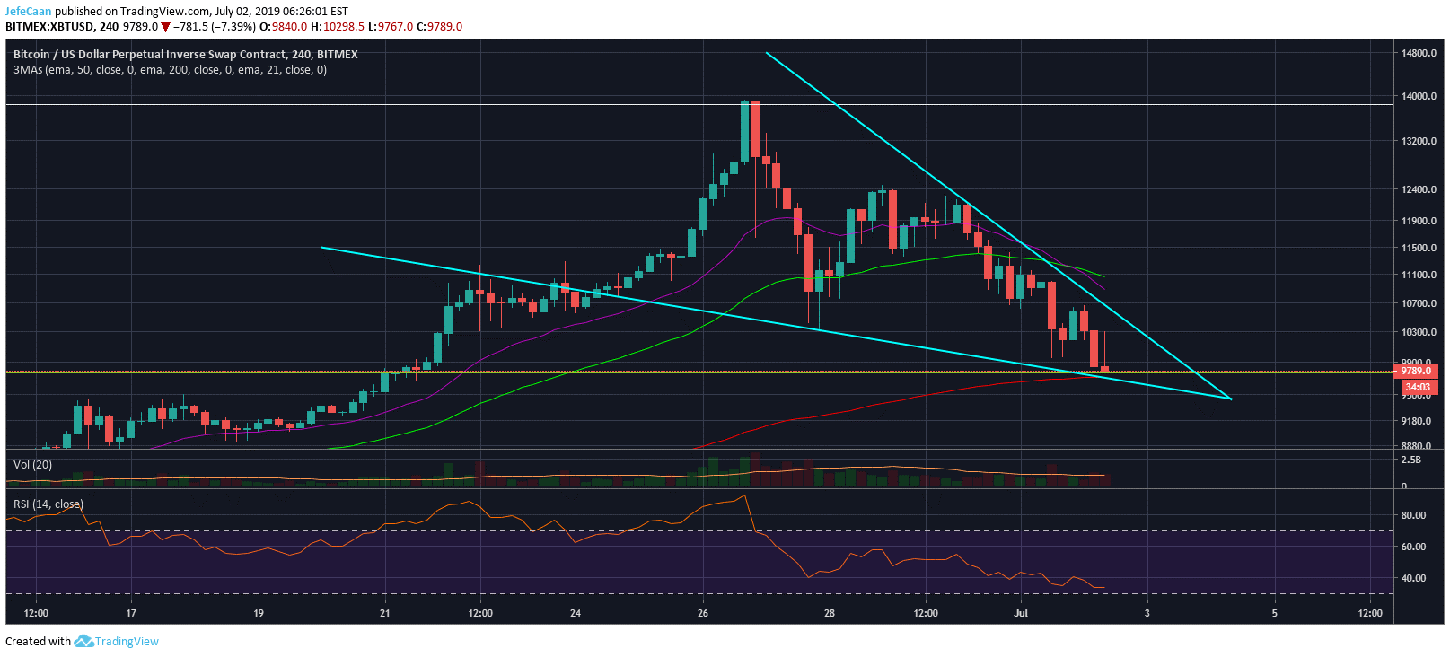
Bitcoin (BTC) has declined sharply below $10,000 but the 4H chart for BTC/USD tells us that there is a high probability that the price might end up rising above this mark again. In fact, not just that, we are likely to see a break out of the falling wedge any time soon. This could help the price rally towards $11,000 with possible resistance around the 50 EMA. However, the long term outlook remains unchanged. For traders, this might be a good opportunity to buy now in anticipation of a rally. Those that are net short might find this a good opportunity to better hedge their bets but this is no different than buying BTC/USD around $18,000 just because we had a pullback. Now, this is certainly not a small pullback, but in the grand scheme of things and where we expect the price to go, it is.
Consider this, if you bought BTC/USD around $6,000 in anticipation of this rally, you just got extremely lucky and ended up making a return of around 126% on your investment. Now, if you did not sell and the price declined only 56%, you lost the 126% gain. This is a very important concept that many traders fail to understand because risk management is often ignored by retail traders. In fact, most of them lay too much emphasis on the charts. There have been case studies of people employing good risk management and entering positions on the outcome of a coin flip making more money than traders that enter and exit positions based on some lines on a chart that are broken. The difference between a good trader and a poor trader is that the good trader knows that it is not about the lines, but what those lines represent.
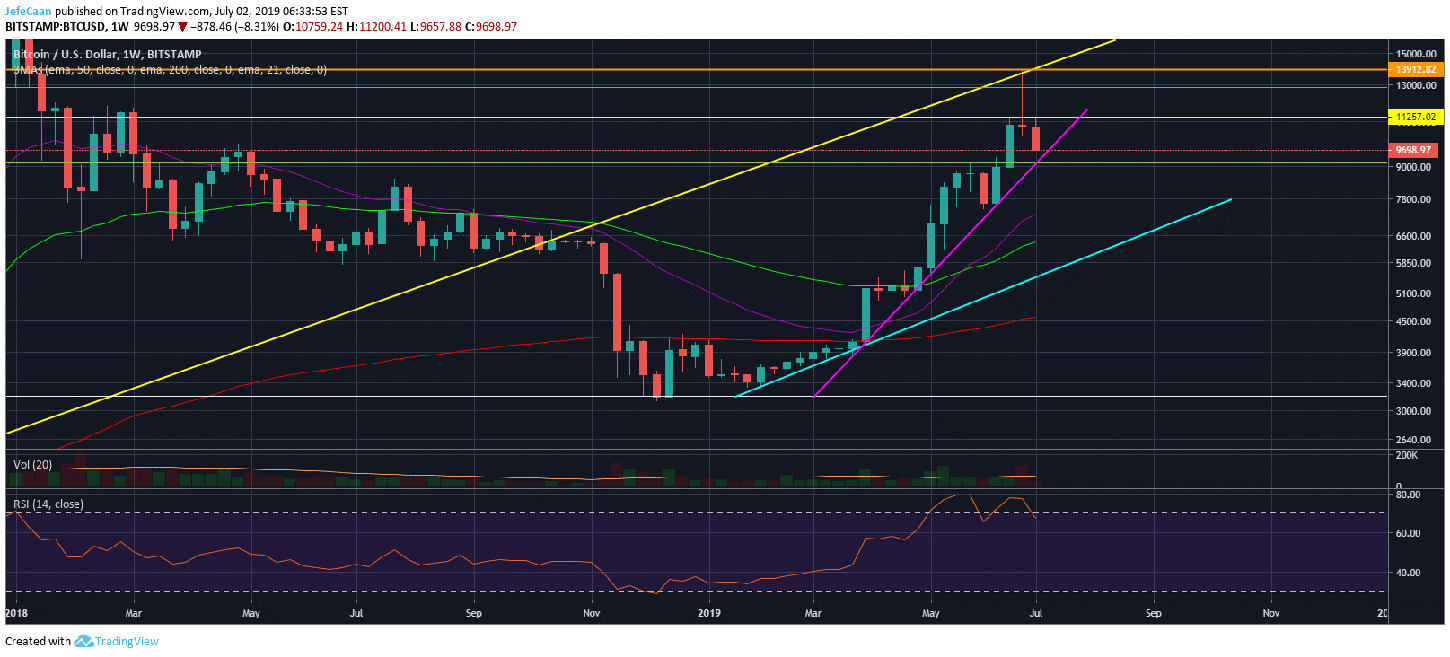
If we look at the weekly chart for BTC/USD, we see the purple trend line and we say “support”. Sure, that is one way to look at it and it has certainly been a good support for the parabolic advance, but what has this line actually meant? This was the line that provided the price a platform to bounce after short sideways movement. This sideways movement was four candles for the first advance and then three candles for the second advance above the 50 Week EMA.

So, what can we expect now? We can expect the price to finish this week with a rend candle to begin the next one with a green candle that reaches the top of the candle. This would be a two candles sideways move, but does it mean the price can begin another bullish advance? Well, this is where we look beyond the trend lines. If we look at the last week close, we can see a gravestone doji which usually marks the beginning of a trend reversal. So, if the price falls 55% from here to the next trend line support, not only will you lose all your gains made since $6,000 but you will also love more than 20% of your portfolio value. So, while traders may still be able to benefit from a near term move to the upside, this is not a good time to be buying BTC/USD for long term value investors.