Bitcoin
Bitcoin (BTC/USD) searched for direction early in today’s Asian session as the pair continues to orbit a relatively tight range following its sharp decline during Saturday’s North American session that saw the pair eventually reach the 9,285.48 area, representing the 50% retracement of the move from 4,702.53 to 13,868.44. The pair’s next upside price objective related to this range is 10,367.06 and the pair’s next downside price objective related to this range is 8,203.91. After testing 9,285.48, traders have lacked firm conviction to take BTC/USD in a new direction.
The 50-bar MA (4-hourly) once again proved to be toppish before the pair’s descent over the weekend, and BTC/USD is now trading well below its 50-bar MA (4-hourly) and 50-bar MA (hourly), with the 100-bar MA and 200-bar MA for both periodicities above their 50-bar MA. Chartists are closely monitoring some key levels to the downside now with the 9,146.46 area representing an important downside target, and some Stops expected below. Also, the 8,694.38 and 8,604.25 areas represent additional downside targets, and if technical Support around those areas gives way, there are also likely to be Stops in place below.
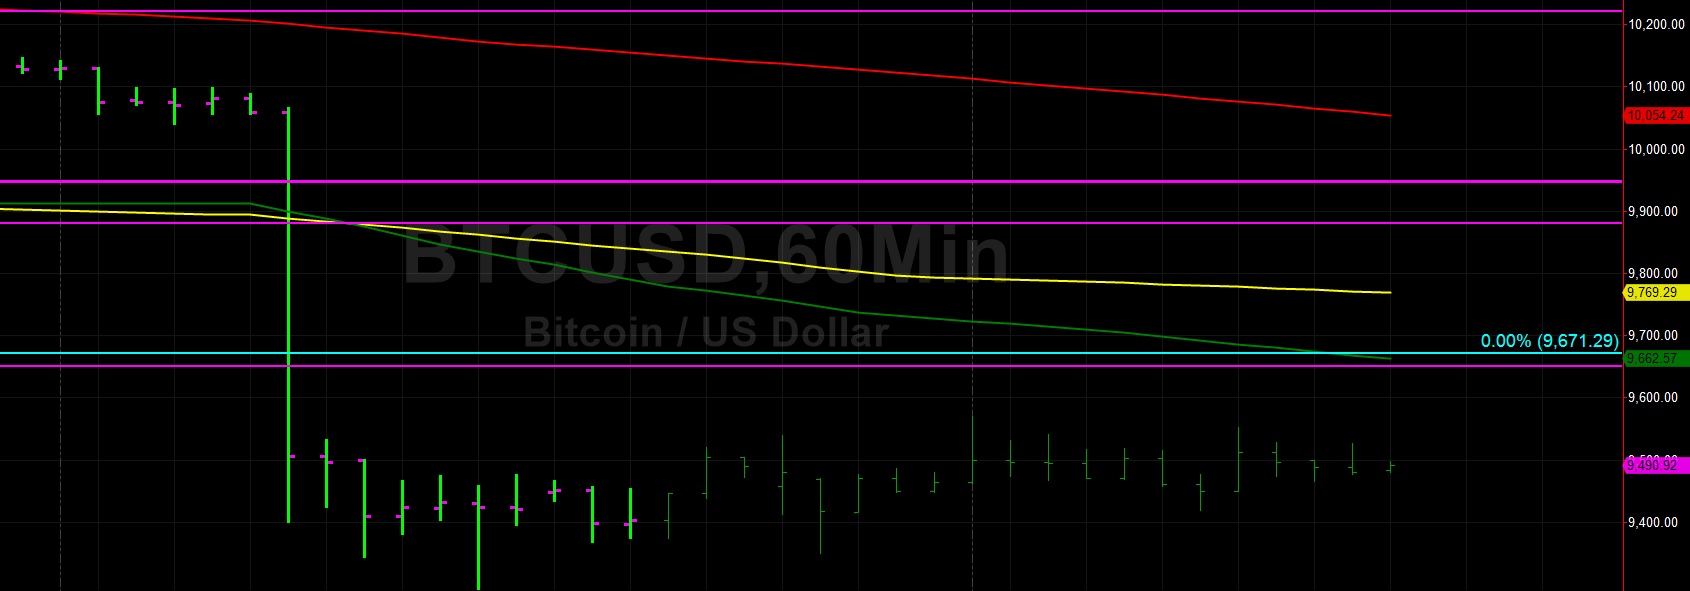
Price activity is nearest the 50-bar MA (4-hourly) at 10,038.45 and the 50-bar MA (Hourly) at 9,668.84.
Technical Support is expected around 9,285.48/ 9,071.00/ 8,488.00 with Stops expected below.
Technical Resistance is expected around 10,268.07/ 10,508.20/ 10,958.60 with Stops expected above.
On 4-Hourly chart, SlowK is Bullishly above SlowD while MACD is Bearishly below MACDAverage.
On 60-minute chart, SlowK is Bearishly below SlowD while MACD is Bullishly above MACDAverage.
Ethereum
Ethereum (ETH/USD) had a weaker bias early in today’s Asian session following the pair’s plunge lower on Saturday that saw it sharply move from 224.14 to 202.46 in very short order. The move to that low on Saturday represented a technical test of the 61.8% retracement of the move from 148.81 to 288.77. The pair’s next upside price level target related to that range is the 218.79 area and the pair’s next downside level related to that range is the 181.84 area.
ETH/USD is now trading below its 50-bar MA (4-hourly) and its 50-bar MA (hourly) with the 100-bar MAs and 200-bar MAs for both periodicities above their 50-bar MAs. Technicians are eyeing the 195.31 area as a nearby downside price extension objective for the pair, and given the pair’s failure to test it on 23 July during its move lower, it is likely there are some sizable Stops in place below that could propel the pair to weaker levels. Below that area, the 170.14 area is an additional downside price target.
Price activity is nearest the 50-bar MA (4-hourly) at 217.11 and the 50-bar MA (Hourly) at 212.85.
Technical Support is expected around 197.56 / 191.40/ 183.33 with Stops expected below.
Technical Resistance is expected around 222.55/ 229.46/ 233.00 with Stops expected above.
On 4-Hourly chart, SlowK is Bullishly above SlowD while MACD is Bearishly below MACDAverage.
On 60-minute chart, SlowK is Bearishly below SlowD while MACD is Bullishly above MACDAverage.