Sally Ho's Technical Analysis 6 June 2019
Bitcoin
Bitcoin (BTC/USD) strengthened a little bit early in today’s Asian session as the pair traded as high as 7392.87 before yielding some early gains and moving back to the 7750.68 area. The price continues to orbit the 7845.00 level, representing the 50% retracement of the move from 6600.00 to 9090.00, after having traded as low as the 7427.00 area this week. The 7881.70 level has also served as some technical Resistance for the pair this week, representing the 76.4% retracement of the projected move from 7470.51 to 9213.84, with the latter price being a key upside price objective extension that has not traded for several months.
Similarly, chartists are watching the 8002 level as an important level, as this area has served as some technical Resistance over the past few sessions and it represents the 61.8% retracement of the projected move from 6600 to 10,271, with the latter being a key upside price objective extension that has also not traded for several months. Given the recent pullback lower, traders are focusing on some key downside levels including the 7303.06 area, representing the 50% retracement of the 5516.12 – 9090.00 range, with the 6881.34 area representing the 61.8% retracement of the same range. Other relevant levels include 7223/ 7187/ 7084/ 7028.
Price activity is nearest the 200-bar MA (4-hourly) at 7548.96 and the 50-bar MA (Hourly) at 7806.42.
Technical Support is expected around 7343.17/ 7187.64/ 6881.34 with Stops expected below.
Technical Resistance is expected around 8230.98/ 8566.38/ 8761.96 with Stops expected above.
On 4-Hourly chart, SlowK is Bullishly above SlowD while MACD is Bearishly below MACDAverage.
On 60-minute chart, SlowK is Bullishly above SlowD while MACD is Bullishly above MACDAverage.
Ethereum
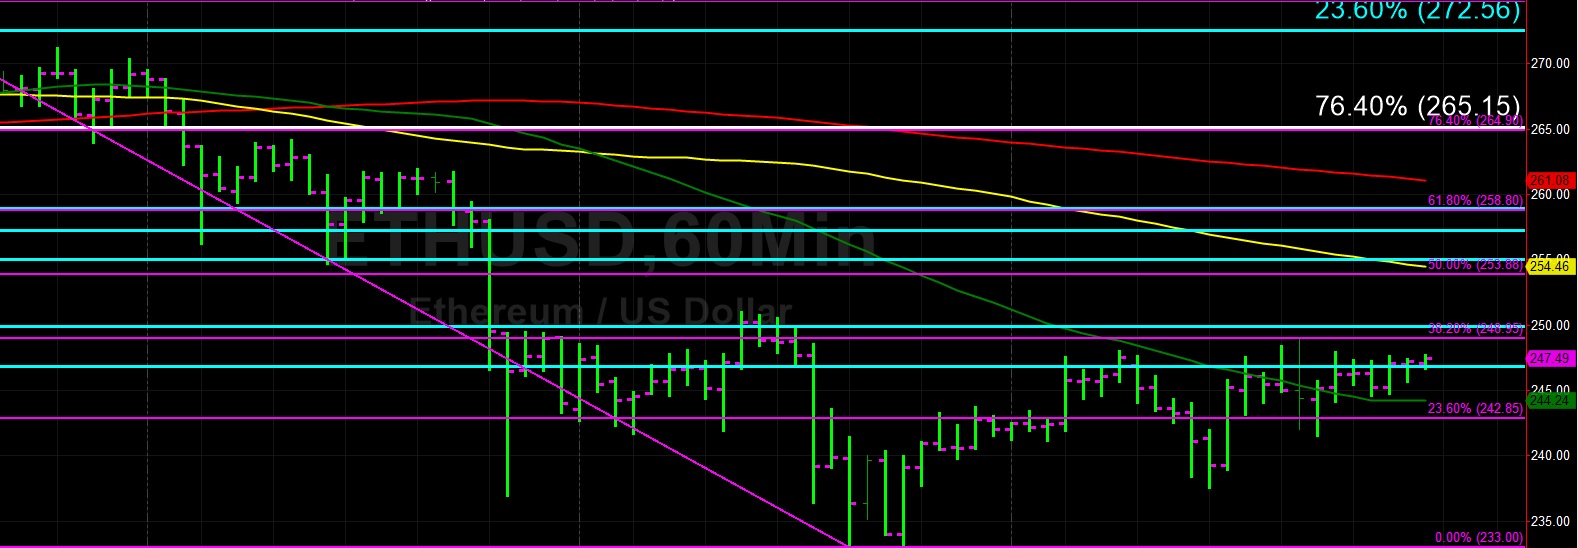
Ethereum (ETH/USD) appreciated modestly early in today’s Asian session as the pair was lifted as high as the 249.00 area before coming off and trading as low as the 244.61 area. ETH/USD has generally traded sideways this week but has shown a hint of an upward bias over the past several trading sessions after testing Bids around the 233.00 level. Notably, yesterday’s intraday high of 249.00 was right around the 38.2% retracement of the move from 247.75 to 233.00.
Above current price activity, chartists are focusing on areas like 253/ 258/ 264 as technical Resistance. Additionally, the 267.47 and 275.61 levels are also important upside retracement levels that relate to the recent downturn from the 288.77 area. The 246.16 area is also an important one as ETH/USD must firmly establish a base above this area that it has recently orbited if it is to make any sort of upside headway. Below current price levels, important areas include the 231 and 223 levels and the 217.55 area represents the 61.8% retracement of the move from 302.20 to 80.60.
Price activity is nearest the 100-bar MA (4-hourly) at 257.88 and the 50-bar MA (Hourly) at 244.24.
Technical Support is expected around 231.12/ 223.08/ 217.39 with Stops expected below.
Technical Resistance is expected around 249.08/ 262.11/ 276.18 with Stops expected above.
On 4-Hourly chart, SlowK is Bullishly above SlowD while MACD is Bullishly above MACDAverage.
On 60-minute chart, SlowK is Bullishly above SlowD while MACD is Bullishly above MACDAverage.
