Bitcoin
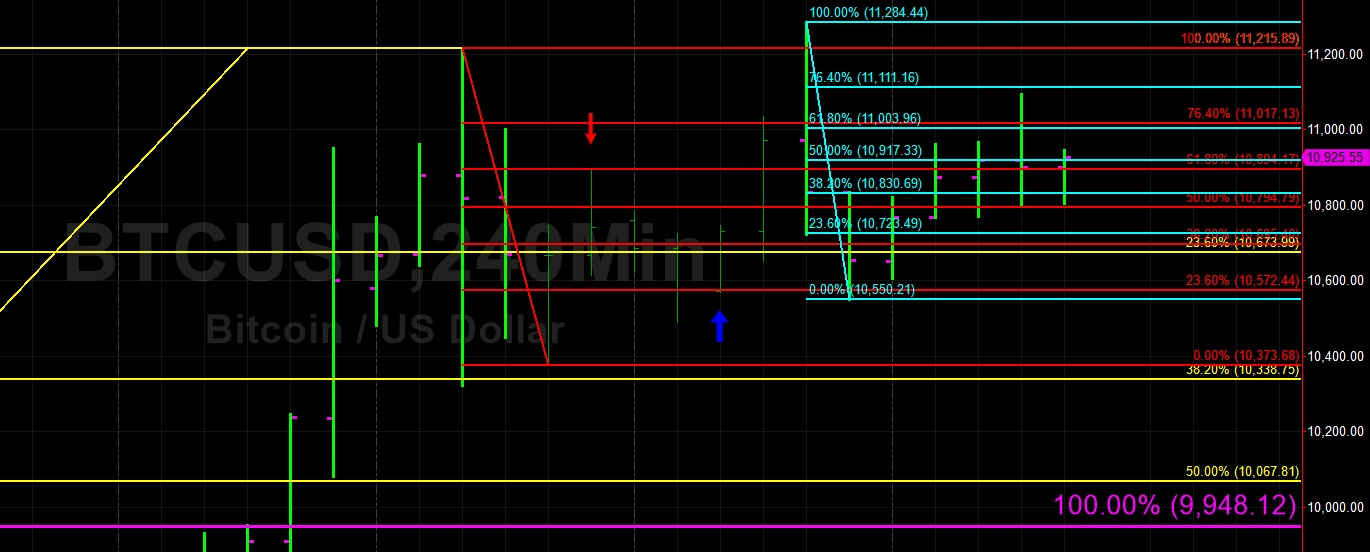
Bitcoin (BTC/USD) moved higher marginally early in today’s Asian session as traders lifted the pair to the 10,944.99 area and contemplated another run at the psychologically-important 11,000 figure. Buying demand emerged around the 10,794.79 area during yesterday’s European and North American sessions, representing the 50% retracement of the recent 11,215.89 – 10,171.68 range. Traders briefly pushed BTC/USD back above the 11,000 figure to the 11,091.97 area during yesterday’s North American session before the pair moved back below the 11,000 figure.
Selling pressure emerged just below the 11,111.16 area during yesterday’s push higher, right around the 76.4% retracement of the move from 11,284.44 to 10,550.21. The pair’s multi-hour technical Support at repetitive levels suggests the pair may be getting ready to make another move higher. BTC/USD must again challenge the 11,116 area if it is to make a decisive break higher, an area that represents an upside price extension objective, followed by the 11,969 area. Below current market activity, chartists expect Bids around the 10,427 and 9,739 areas.
Price activity is nearest the 50-bar MA (4-hourly) at 9849.81 and the 50-bar MA (Hourly) at 10769.12.
Technical Support is expected around 10338.75/ 10067.81/ 9796.86 with Stops expected below.
Technical Resistance is expected around 11510.44/ 11969.22/ 13347.06 with Stops expected above.
On 4-Hourly chart, SlowK is Bullishly above SlowD while MACD is Bearishly below MACDAverage.
On 60-minute chart, SlowK is Bearishly below SlowD while MACD is Bearishly below MACDAverage.
Ethereum
Ethereum (ETH/USD) was pressured early in today’s Asian session as the pair tested Bids around the 305.07 area after trading as high as the 313.10 area during yesterday’s North American session. During yesterday’s late European and North American sessions, Bids repeatedly emerged at or above the 304.55 area, representing the 23.6% retracement of the move from 261.00 to 318.00. The move higher during yesterday’s North American session ran out of steam right around the 76.4% retracement of the move from 318.00 to 295.68.
ETH/USD’s recurrent Bids suggest the pair could be primed for additional upside Buying pressure. Chartists are looking to see what the pair does on its next test of the 314.00 figure, as it represents the 50% retracement of the move from 547.40 to 80.60. Above this level, the 337 level is an important upside price extension objective. A flurry of Bids are expected around the 294 – 298 range, levels that have assumed importance following the recent base of 226.35. Technicians anticipate additional technical Support around the 281.84 area, and additional buying pressure is expected between the 271 – 275 areas.
Price activity is nearest the 50-bar MA (4-hourly) at 285.18 and the 50-bar MA (Hourly) at 308.59.
Technical Support is expected around 282.63/ 278.50 / 274.37 with Stops expected below.
Technical Resistance is expected around 318.00/ 337.33/ 349.60 with Stops expected above.
On 4-Hourly chart, SlowK is Bullishly above SlowD while MACD is Bearishly below MACDAverage.
On 60-minute chart, SlowK is Bearishly below SlowD while MACD is Bullishly above MACDAverage.