Bitcoin
Bitcoin (BTC/USD) gave back a small amount of hard-fought gains early in today’s Asian session after the pair rocketed to its highest level since 30 May at 8916.63 during yesterday’s North American session. Stops were elected above the 8707.00 figure during recent trading sessions, representing the 23.6% retracement of the move from 7467.10 to 9090.00. Some very important technical clues emerged during yesterday’s European and early North American sessions when Bids repeatedly emerged around the 8635 – 8640 areas, now equal to the 23.6% retracement of the 7702.83 – 8916.63 range.
BTC/USD’s upward moves again shifts the focus to upside price targets and areas of technical Support during pullbacks. If the market is able to absorb the 2019 high of 9090.00, traders will again focus on the 9532.39 area, representing the 38.2% retracement of the very important move from 19891.99 to 3128.89. Above that area, the 9948.12 area is a relative high. Below current market activity, the 8630.17 area may provide some technical Support, representing the 23.6% retracement of the move from 7702.83 to 8916.63. Other areas of technical Support include 8584/ 8338/ 8166.
Price activity is nearest the 100-bar MA (4-hourly) at 8162.03 and the 50-bar MA (Hourly) at 8555.46.
Technical Support is expected around 8585.10/ 8278.55/ 8087.05 with Stops expected below.
Technical Resistance is expected around 9090.00/ 9532.19/ 9948.12 with Stops expected above.
On 4-Hourly chart, SlowK is Bearishly below SlowD while MACD is Bullishly above MACDAverage.
On 60-minute chart, SlowK is Bearishly below SlowD while MACD is Bearishly below MACDAverage.
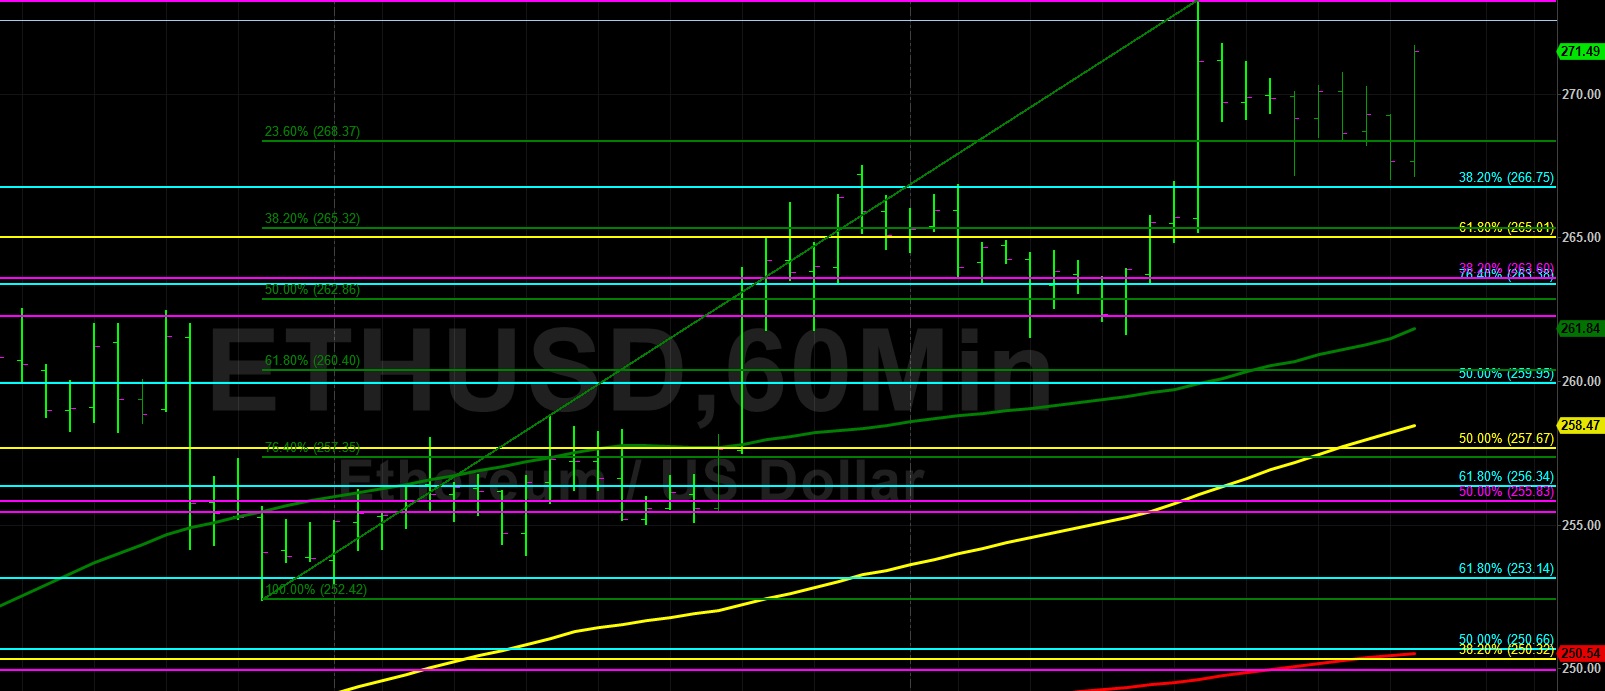
Ethereum
Ethereum (ETH/USD) came off a little bit early in today’s Asian session as the pair moved lower to the 267.02 area after peaking around the 273.30 area late in yesterday’s North American session, its strongest print since 2 June. Some technical clues became evident during yesterday’s European and North American sessions when Bids emerged repeatedly just below the 262.27 area, representing the 23.6% retracement of the move from 226.56 to 273.30. Those Bids emerged after Stops were elected above the 265.01 area, representing the 61.8% retracement of the move from 288.77 to 226.56.
ETH/USD has an upward bias but it is staring at an important level in 274.09, representing the 76.4% retracement of the aforementioned 288.77 – 226.56 range. During pullbacks lower, chartists will be looking to see if technical Support can be derived around the 262/ 255/ 249 levels. Above current market activity, the 288.77 is a recent relative high and the 302.20 area is another relative high. The 289.64 area is the 38.2% retracement of the move from 627.83 to 80.60 and the 293.56 area is the 23.6% retracement of the move from 982.99 to 80.60. Also, the 298.24 level is the 50% retracement of the move from 515.88 to 80.60 and the 314.00 area is the 50% retracement of the 547.40 – 80.60 range.
Price activity is nearest the 100-bar MA (4-hourly) at 253.30 and the 50-bar MA (Hourly) at 261.82.
Technical Support is expected around 255.45/ 246.23/ 241.17 with Stops expected below.
Technical Resistance is expected around 288.77/ 293.56/ 302.20 with Stops expected above.
On 4-Hourly chart, SlowK is Bullishly above SlowD while MACD is Bullishly above MACDAverage.
On 60-minute chart, SlowK is Bullishly above SlowD while MACD is Bullishly above MACDAverage.