Bitcoin
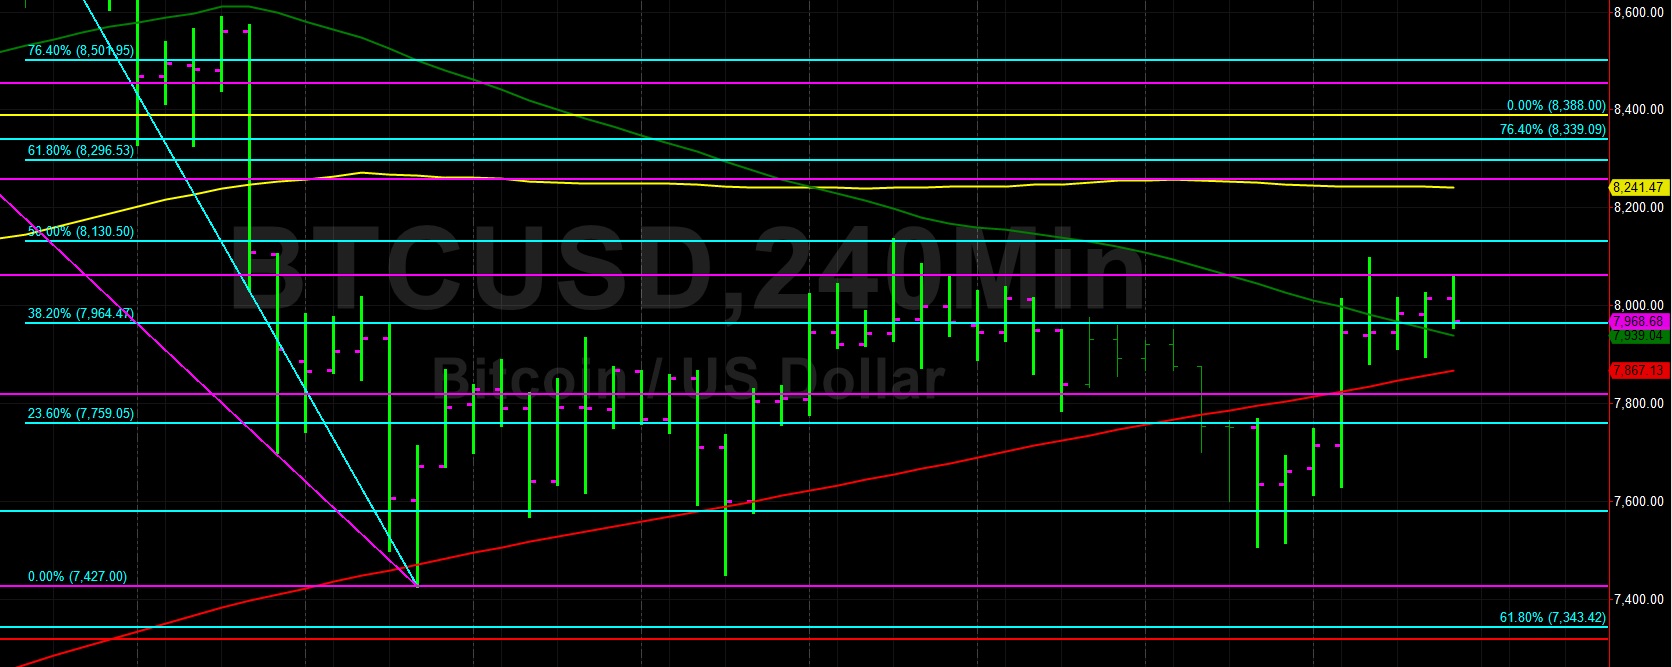
Bitcoin (BTC/USD) moved back above the psychologically-important 8,000 figure early in today’s Asian session as traders lifted the pair to the 8057.19 area after it had traded as low as the 7895.96 area during yesterday’s North American session. Yesterday’s daily high was actually reached during the European session when BTC/USD gained ground and climbed to the 8097.35 area after again Bullishly moving above the 50-bar MA (4-hourly). Some Stops were elected above the 8062.27 area during the move higher, representing the 38.2% retracement of the move from 9090.00 to 7427.00.
This most recent resurgence in BTC/USD over the past couple of days has some chartists again focused on the upside. The 8258.50 and 8454.73 areas represent the 50% and 61.8% retracements of the aforementioned range and Stops are likely in place above these areas. Another very important level is the 8338.78 area, representing the 76.4% retracement of the move from 9948.12 to 3128.89. Additionally, the 100-bar MA (4-hourly) is now indicating around the 8241.52 area. Below current market activity, the 200-bar MA (hourly) is above the 100-bar MA (hourly) and 50-bar MA (hourly).
Price activity is nearest the 50-bar MA (4-hourly) at 7939.22 and the 200-bar MA (Hourly) at 7945.02.
Technical Support is expected around 7343.17/ 7187.64/ 6881.34 with Stops expected below.
Technical Resistance is expected around 8230.98/ 8566.38/ 8761.96 with Stops expected above.
On 4-Hourly chart, SlowK is Bullishly above SlowD while MACD is Bullishly above MACDAverage.
On 60-minute chart, SlowK is Bearishly below SlowD while MACD is Bullishly above MACDAverage.
Ethereum
Ethereum (ETH/USD) reversed course early in today’s Asian session as the pair tested the 249.38 level after attempting to gain a foothold above the 50-bar MA (4-hourly) but then fell to the 245.26 area. The pair found some good buying activity late in yesterday’s North American session and was lifted to multi-session highs, testing the 61.8% retracement of the move from 222.88 to 288.77. Strong bids emerged during yesterday’s European session that saw ETH/USD gain ground from the 233.32 area.
Chartists note that today’s intraday high was right around the 23.6% retracement of the 233.00 – 254.40 range. The pair’s inability to sustain its brief amount of time above the 200-bar MA (hourly) is generally Bearish and refocuses attention on the 100-bar MA (hourly), now indicating around 243.58. If the pair is able to extend its recent upward trajectory, some key levels are found between the 250 – 254 range. Also, the 255.83 area is the 50% retracement of the move from 222.88 to 288.77 and the 256.34 area is the 61.8% retracement of the move from 274.75 to 226.56.
Price activity is nearest the 50-bar MA (4-hourly) at 246.44 and the 200-bar MA (Hourly) at 246.61.
Technical Support is expected around 223.08 / 217.55/ 209.75 with Stops expected below.
Technical Resistance is expected around 249.90/ 258.80/ 266.75 with Stops expected above.
On 4-Hourly chart, SlowK is Bullishly above SlowD while MACD is Bullishly above MACDAverage.
On 60-minute chart, SlowK is Bearishly below SlowD while MACD is Bullishly above MACDAverage.