Ethereum (ETH) Has Formed A Massive Bear Flag, Here Is What It Means
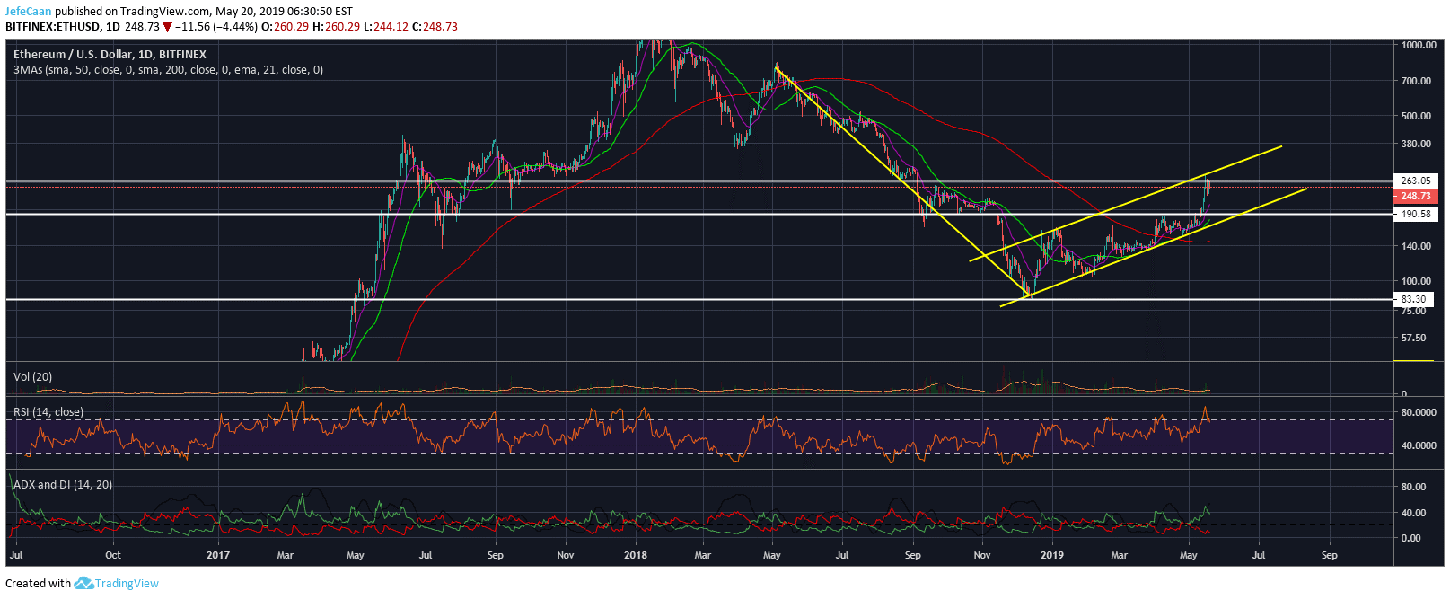
Ethereum (ETH) has just begun its decline after testing the top of the ascending channel at around $263. If the price were to fall to the bottom of the channel, we could see ETH/USD plunge below $200 but that’s not all. In fact, ETH/USD has now formed a massive bear flag that could end really badly. This bear flag is like a ticking time bomb waiting to take Ethereum (ETH) down sooner or later. RSI is still hovering around overbought levels and the ADX and DI indicator points to near term bearish outlook. We have mentioned in our previous analyses that we see ETH/USD at $60 or lower levels by the end of the year. This is very likely to happen during Ethereum (ETH)’s next downtrend. In technical analysis, the more the price tests a certain line, the more likely it is to break it.
If the price comes down to test the bottom of the ascending channel again, it is very likely that it will break it this time especially under such overbought conditions on the daily and weekly time frames. Ethereum (ETH) has been on a wild buying spree that has left even the most skilled traders dumbfounded. A lot of seasoned traders have found it hard to make any sense of the recent rallies in ETH/USD when every major indicator is screaming sell, sell, sell. However, those that have been around for long in this market should have seen this coming. Unlike other markets, people in this market are not afraid of price manipulation or its repercussions. Sure, there is manipulation in every market but it gets a little shameless in here as the whale have no regard for any rules, principles or ethics in the absence of proper regulatory framework.
Now, a lot of retail bulls get annoyed when someone talks of manipulation in this market because they do not want anyone waking them up from their lambo dreams. However, as we have seen time and time again it is these guys that get hunted in the end. The end result of all this is to use dead bears to lure in unsuspecting bulls and then trap them harder. The bulls always get hurt more because they are more gullible than the bears. As long as the whales know that there are people looking for the price to rocket to the moon, they are going to keep this dream alive.

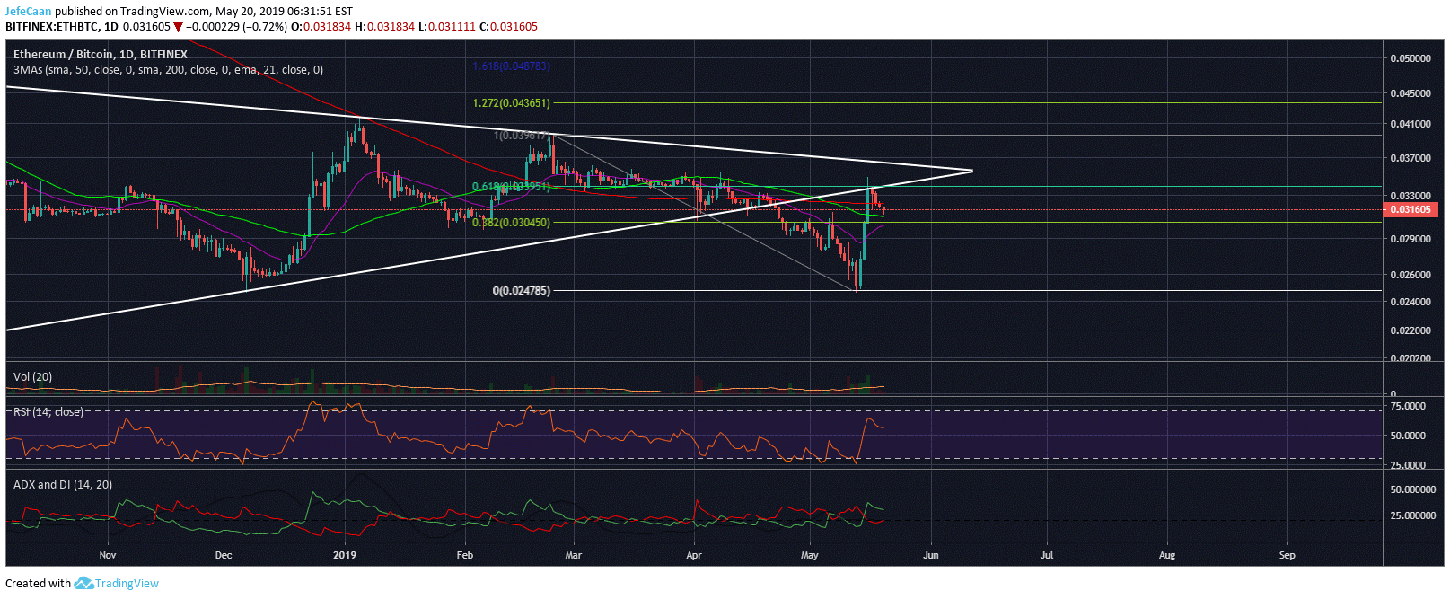
The daily chart for ETH/BTC is a good indicator of where Ethereum (ETH) really stands and what it risks ahead. The price broke below the trend line support and is now trading below the pennant. It tested the trend line support as resistance and faced a strong rejection at the 61.8% Fib retracement level. The price is now expected to decline to the 38.2% fib retracement level but it is unlikely to stay there for long. In fact, Ethereum (ETH) is poised for another major downtrend against Bitcoin (BTC), one that is unlikely to come to an end until most of the useless Ethereum ICO coins are wiped off the market.