Bitcoin Volatility Index (BVOL) Points To High Probability Of A Sluggish Rally
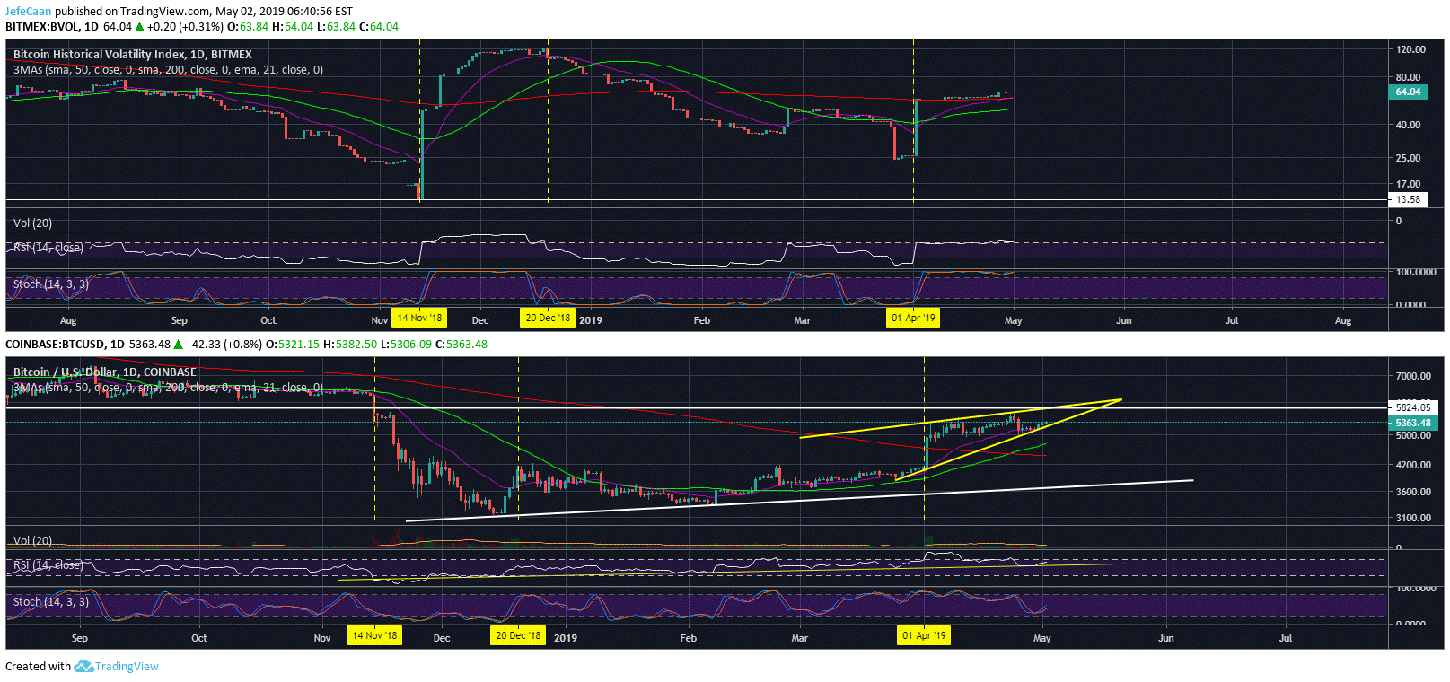
Bitcoin (BTC) is struggling to rally towards $5,800-$6,000. While most traders are expecting a big move towards this strong resistance zone, the price action clearly shows that BTC/USD is not ready for such a move. However, now the Bitcoin Volatility Index (BVOL) also corroborates what is going on with the price and suggests that we might see a sluggish rally in the days and weeks ahead but it will happen nonetheless. This rally towards the resistance zone at $5,800-$6,000 is important because the price has to either break it or face rejection at this zone in order for the market to turn bullish or bearish. So far, the game plan looks very clear and if we compare the two charts for Bitcoin Volatility Index (BVOL) and Bitcoin (BTC/USD) we can see what happened in the recent past and what might happen in the near future.
First of all, let us look at the volatility index around November 14, 2018. Volatility had bottomed around that time and it was clear that BTC/USD had to make a big move. Sure enough, BTC/USD made that big move and broke market structure. The price of Bitcoin (BTC) continued to decline while the volatility index continued to rise. When the volatility index started to decline after December 20, 2018, the price of Bitcoin (BTC) started to decline in a sluggish manner until the volatility index found a temporary bottom around April 01, 2019. When the volatility index spiked after that, so did the price of Bitcoin (BTC). One thing to note here is that movements on the volatility index are a consequence of the price action and not the other way around. The analysis uses the volatility index as a guide for the price action for the purpose of simplicity.
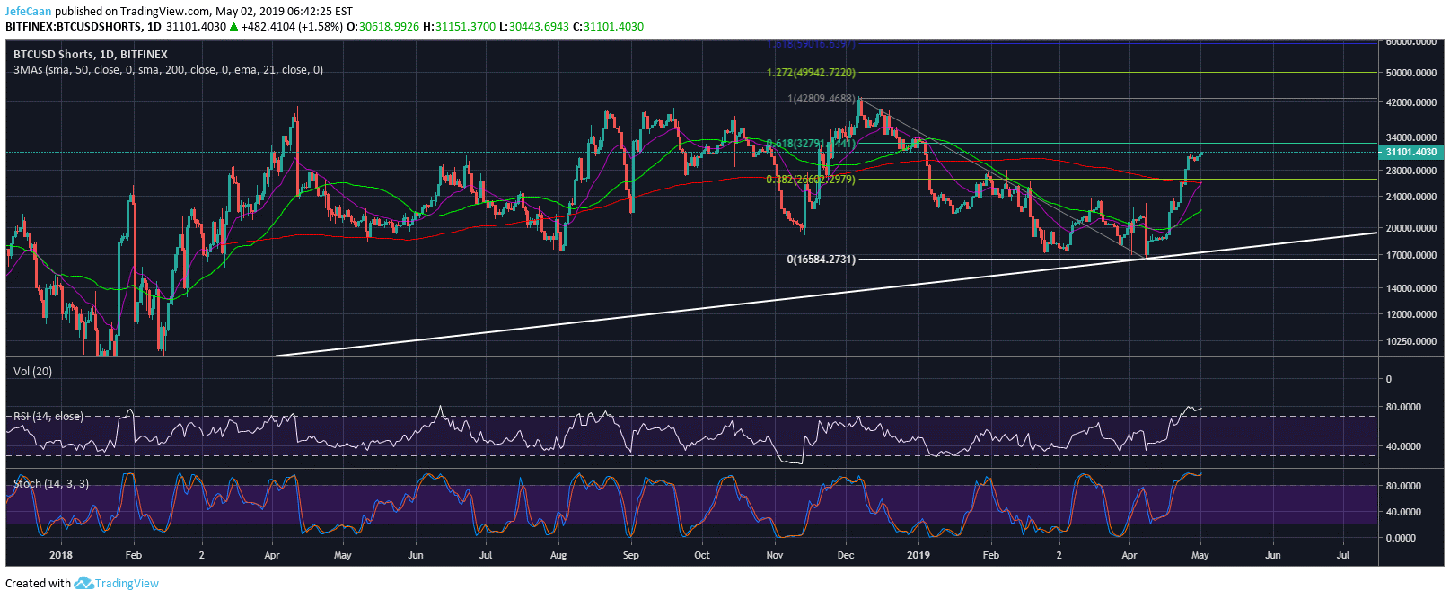
The volatility index has topped out now and we will see a decline in volatility in the days and weeks ahead. Professional traders who have been following price action for years can tell that right off the chart of Bitcoin (BTC) but others have to look at the volatility index or other indicators to get more insights regarding the price action. One useful indicator besides the volatility index is BTCUSDShorts. This is often a contrarian indicator because when the number of margined shorts rises too high, it shows that a large number of retail traders are hoping the price will come down which is why the opposite happens most of the time.
In every battle, it is important to know thyself and know the enemy. Trading is a zero sum game which means every dollar you lose, you pay to someone else and every dollar you win you take from someone else. This means that apart from you, everybody else in this market is an enemy. The trend is your only friend, but you should know when to part ways when your friend begins to change their loyalty. So far, the bulls have a good chance of making that rally towards $5,800-$6,000 but this is not the time to be doing anything ambitious on the bullish side because the big picture remains intact and the price is long overdue for a big move to the downside.