Published
5 years ago on
April 20, 2019
Bitcoin
Bitcoin (BTC/USD) extended recent gains as the pair tested a key area of technical Resistance, consolidated gains, and then found additional Bids. Traders tested the 5349.70 area, representing the 76.4% retracement of the 5488.00 – 4901.99 range and an upside target that we identified in our 19 April 2019 analysis. Profit-taking then pushed the pair below another key technical area, the 5265.70 area, representing the 50% retracement of the 7402.50 – 3128.89 area.
Chartists are eager to see if BTC/USD can establish a supportive base around the 5265 – 5195 range in an attempt to test some additional technical Resistance. As we have noted in recent analyses, the 5403.82 area represents the 61.8% retracement of the 6810.00 – 3128.89 range. Technical targets above there include 5733.84 and 5808.45.
Price activity is nearest the 50-bar MA (4-hourly) at 5153.00 and the 50-bar MA (Hourly) at 5262.83.
Technical Support is expected around 5040.29/ 4877.05/ 4582.91 with Stops expected below.
Technical Resistance is expected around 5403.82/ 5769.98/ 5941.26 with Stops expected above.
On 4-Hourly chart, SlowK is Bearishly below SlowD while MACD is Bullishly above MACDAverage.
On 60-minute chart, SlowK is Bullishly above SlowD while MACD is Bullishly above MACDAverage.
Ethereum
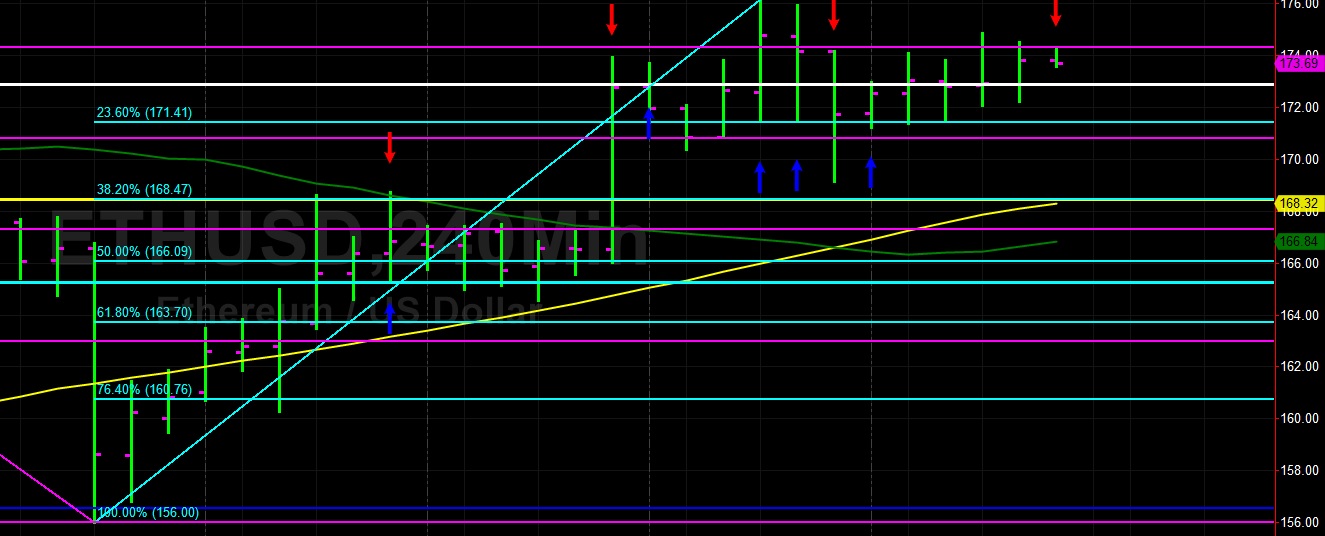
Ethereum (ETH/USD) continued to rally in the Asian session after trading as high as the 174.84 level during yesterday’s North American session. The 174.31 level represents the 61.8% retracement of the 185.62 – 156.00 range and the pair probed Offers above there yesterday. The 171.41 level is an area where the pair has been trying to establish Support over the past couple of days, technically representing the 23.6% retracement of the move from 156.00 to 176.17.
Technicians are looking to see if the pair can establish a base around the 172.88 area, representing the 38.2% retracement of the 322.16 – 80.60 range. Additional upside targets include the 179.98/ 183.33/ 189.23 areas.
Price activity is nearest the 100-bar MA (4-hourly) at 168.32 and the 50-bar MA (Hourly) at 172.48.
Technical Support is expected around the 162.99/ 156.53/ 151.69 levels with Stops expected below.
Technical Resistance is expected around the 179.40/ 185.62/ 214.08 levels with Stops expected above.
On 4-Hourly chart, SlowK is Bullishly above SlowD while MACD is Bullishly above MACDAverage.
On 60-minute chart, SlowK is Bullishly below SlowD while MACD is Bullishly above MACDAverage.
Investment Disclaimer