Published
5 years ago on
April 19, 2019
Bitcoin
Bitcoin (BTC/USD) weakened during today’s Asian session as the pair depreciated to the 5196.70 level, a key retracement level that is right around the 50% retracement of the 5488.00 – 4901.99 range. The pair has orbited this area throughout the week and traders await indications if the pair will be able to make a sustained move above or below.
BTC/USD traded as high as 5318.18 during yesterday’s North American session, representing its strongest print since 10 April. As we have written all week in our analyses including 18 April 2019, the pair has largely been supported around the 5176.07 area, representing the 38.2% retracement of the 8488.00 - 3128.89 range.
A break lower may see BTC/USD test the 50-bar MA (4-hourly) and then retracement levels including 5125.85 and 5040.29. A break higher may see BTC/USD test retracement levels including 5349.70 and 5403.82, levels we have repeatedly spotlighted.
Price activity is nearest the 50-bar MA (4-hourly) at 5140.28 and the 50-bar MA (Hourly) at 5243.90.
Technical Support is expected around 5040.29/ 4877.05/ 4582.91 with Stops expected below.
Technical Resistance is expected around 5403.82/ 5769.98/ 5941.26 with Stops expected above.
On 4-Hourly chart, SlowK is Bearishly below SlowD while MACD is Bullishly above MACDAverage.
On 60-minute chart, SlowK is Bullishly above SlowD while MACD is Bearishly below MACDAverage.
Ethereum
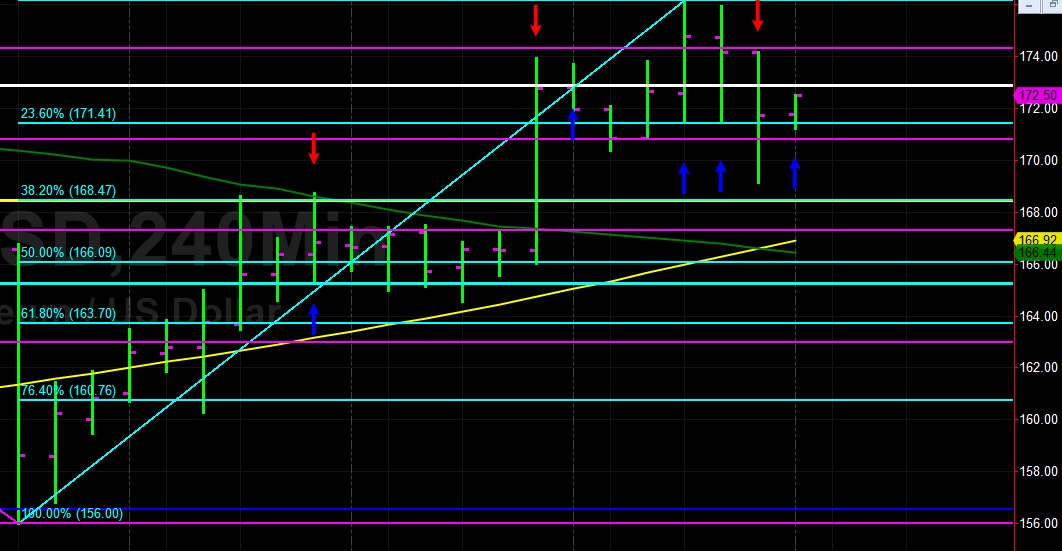
Ethereum (ETH/USD) lost ground during the Asian session after peaking around the 176.17 level during yesterday’s North American session, its strongest showing since 10 April. The pair was driven as low as the 169.14 area during today’s intraday price action, stopping short of again testing the 168.47 area, a key level we have written about extensively that represents the 61.8% retracement of the 222.78 – 80.60 range. The 50-bar MA (4-hourly) and 100-bar MA (4-hourly) are situated below.
Any further consolidation may also see ETH/USD test the 165.25 area, a key retracement area that represents the 38.2% retracement of the 302.20 – 80.60 range. Below this area, the 162.99 area could provide some technical Support.
Price activity is nearest the 100-bar MA (4-hourly) at 166.92 and the 50-bar MA (Hourly) at 169.95.
Technical Support is expected around the 162.99/ 156.53/ 151.69 levels with Stops expected below.
Technical Resistance is expected around the 179.40/ 185.62/ 214.08 levels with Stops expected above.
On 4-Hourly chart, SlowK is Bearishly below SlowD while MACD is Bullishly above MACDAverage.
On 60-minute chart, SlowK is Bullishly below SlowD while MACD is Bearishly below MACDAverage.
Litecoin
Litecoin (LTC/USD) continued to orbit key technical levels during the Asian session, trading as low as the 80.02 level after trading as high as the 83.90 area during yesterday’s North American session. Today’s intraday High of 83.38 is right around the 100-bar MA (4-hourly), above which the pair yesterday tested the 83.71 area, representing the 38.2% retracement of the 97.88 – 74.95 range. The 50-bar MA (4-hourly) around 80.11 is just below current price activity.
Another move higher may see LTC/USD test key technical areas including 84.71/ 86.12/ 87.61, some of which we identified in our 16 April 2019 analysis.
As noted in our 15 April 2019 analysis, stronger upside targets include the 87.39 level, representing the 38.2% retracement of the 192.89 – 22.17 range.
Price activity is nearest the 50-bar MA (4-hourly) at 80.11 and the 50-bar MA (Hourly) at 80.62.
Technical Support is expected around the 72.10/ 67.17/ 62.62 levels with Stops expected below.
Technical Resistance is expected around the 87.39/ 92.56/ 102.26 levels with Stops expected above.
On 4-Hourly chart, SlowK is Bearishly below SlowD while MACD is Bullishly above MACDAverage.
On 60-minute chart, SlowK is Bullishly above SlowD while MACD is Bearishly below MACDAverage.
Bitcoin Cash
BCH/USD (Bitcoin Cash/ US dollar) depreciated during today’s Asian session as the pair fell to the 290.00 level after trading as high as the 310.91 area during yesterday’s price activity. Stops were elected below the 294.59 area during today’s downturn, representing the 50% retracement of the 254.17 – 335.00 range.
Chartists are curious to see if the pair can establish a technical base around the 293.41 area, representing the 50% retracement of the 332.64 – 254.17 range. Another nearby area of technical relevance is the 292.37 level, representing the 38.2% retracement of the 354.17 – 254.17 range.
Technicians are also eyeing the 50-bar MA (4-hourly) and 100-bar MA (4-hourly) just below current price activity.
Price activity is nearest the 50-bar MA (4-hourly) at 294.76 and the 200-bar MA (Hourly) at 294.93.
Technical Support is expected around the 277.46/ 265.55/ 254.17 levels with Stops below.
Technical Resistance is expected around the 332.55/ 349.99/ 366.11 levels with Stops above.
On 4-Hourly chart, SlowK is Bearishly below SlowD while MACD is Bearishly below MACDAverage.
On 60-minute chart, SlowK is Bullishly above SlowD while MACD is Bearishly below MACDAverage.
Investment Disclaimer