Bitcoin (BTC/USD) continued to orbit a key technical level during the Asian session today, with the pair dancing around the 5079.35 level, representing the 50% retracement of the move from 4670.69 to 5488.00. As with many assets in the cryptocurrency complex, BTC/USD fell sharply during yesterday’s European session with no discernible technical explanation as to why.
The 5125.85 has also remained toppish since 11 April, representing the 38.2% retracement of the 5488.00 – 4901.99 range as noted in our 13 April 2019 analysis. The 50-bar MA (4-hourly) has also prevented BTC/USD from drifting too far above.
During the past day, price has been supported around the 5040.29 area, representing the 23.6% retracement of the aforementioned 5488.00 – 4901.99 range.
On the downside, Stops are expected below the 4982.90 area.
Chartists are eyeing the 5195.00/ 5264.14 areas as upside technical Resistance with Stops expected above.
Price activity is nearest the 50-bar MA (4-hourly) at 5125.64 and the 50-bar MA (Hourly) at 5065.10.
Technical Support is expected around 4877.05/ 4582.91/ 4393.64 with Stops expected below.
Technical Resistance is expected around 5264.14/ 5403.82/ 5769.98 with Stops expected above.
On 4-Hourly chart, SlowK is Bullishly above SlowD while MACD is Bearishly below MACDAverage.
On 60-minute chart, SlowK is Bearishly below SlowD while MACD is Bearishly below MACDAverage.
Ethereum
Ethereum (ETH/USD) found some Buying pressure early in the Asian session as the pair moved back to the 165.20 level, just below the 165.49 area that represents the 23.6% retracement of the move from 185.62 to 159.27. Chartists are eyeing the 169.34 and 172.45 levels as the next upside targets. Additionally, as noted in our 13 April 2019 analysis, the 168.47 level represents the 61.8% retracement of the 222.78 – 80.60 range, and this is a level where the pair encountered Resistance on 12 April.
Chartists are interested to see what will happen around the 100-bar MA (4-hourly), currently around 158.92, and it is likely there are Stops below this area. A decisive break below this area would open up a possible test of the 151.60 area, representing the 50% retracement of the 222.78 – 80.60 area, below which the 200-bar MA (4-hourly) is around 147.11.
As noted in our 12 April 2019 analysis, the 156.53 level is a major downside focal point for traders, representing the 23.6% retracement of the 80.60 – 179.98 range.
Price activity is nearest the 100-bar MA (4-hourly) at 158.92 and the 50-bar MA (Hourly) at 164.36.
Technical Support is expected around the 152.41/ 144.09/ 130.29 levels with Stops expected below.
Technical Resistance is expected around the 172.45/179.40/ 185.62 levels with Stops expected above.
On 4-Hourly chart, SlowK is Bullishly above SlowD while MACD is Bearishly below MACDAverage.
On 60-minute chart, SlowK is Bullishly above SlowD while MACD is Bullishly above MACDAverage.
Litecoin
Litecoin (LTC/USD) was marginally better early in the Asian session with traders testing the 78.67 level and finding Support around the 77.19 area. The 100-bar MA (4-hourly) is currently around 76.38, and technicians are curious to see if the pair will test this area for the first time since 2 April. On the upside, the pair may seek to reclaim the 79.26 level, representing the 23.6% retracement of the 91.99 – 75.33 range.
On the upside, Stops are expected above the 84.71 level and on the downside, Stops are expected below the 72.16 area.
Price activity is nearest the 100-bar MA (4-hourly) at 76.38 and the 50-bar MA (Hourly) at 78.67.
Technical Support is expected around the 72.10/ 67.17/ 65.60 levels with Stops expected below.
Technical Resistance is expected around the 83.94/ 92.56/ 102.26 levels with Stops expected above.
On 4-Hourly chart, SlowK is Bullishly above SlowD while MACD is Bearishly below MACDAverage.
On 60-minute chart, SlowK is Bullishly above SlowD while MACD is Bullishly above MACDAverage.
Bitcoin Cash
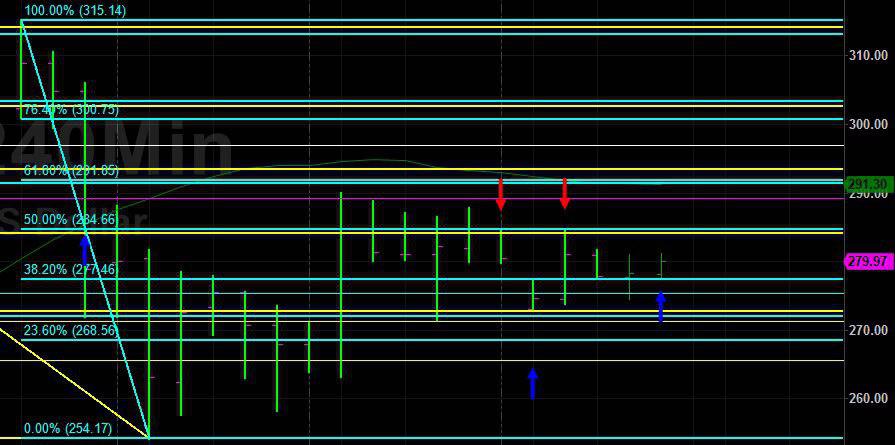
BCH/USD (Bitcoin Cash/ US dollar) traded quite technically into the Asian session as the pair contemplated an additional test of the 284.15 level, representing the 38.2% retracement of the 332.64 – 254.17 range. During the Asian session, some provisional Support emerged around the 277.46 area, representing the 38.2% retracement of the 315.14 – 254.17 range.
Above current trading activity, the 289.18 area is one of significant technical Resistance, representing the 38.2% retracement of the 638.55 – 73.22 range.
On the upside, Stops are expected above the 300.75 level and on the downside, Stops are expected below the 265.55 area.
Price activity is nearest the 50-bar MA (4-hourly) at 291.30 and the 50-bar MA (Hourly) at 277.35.
Technical Support is expected around the 265.55/ 229.49/ 206.64 levels with Stops below.
Technical Resistance is expected around the 294.74/ 306.09/ 332.55 levels with Stops above.
On 4-Hourly chart, SlowK is Bearishly below SlowD while MACD is Bearishly below MACDAverage.
On 60-minute chart, SlowK is Bullishly above SlowD while MACD is Bullishly above MACDAverage.