Bitcoin
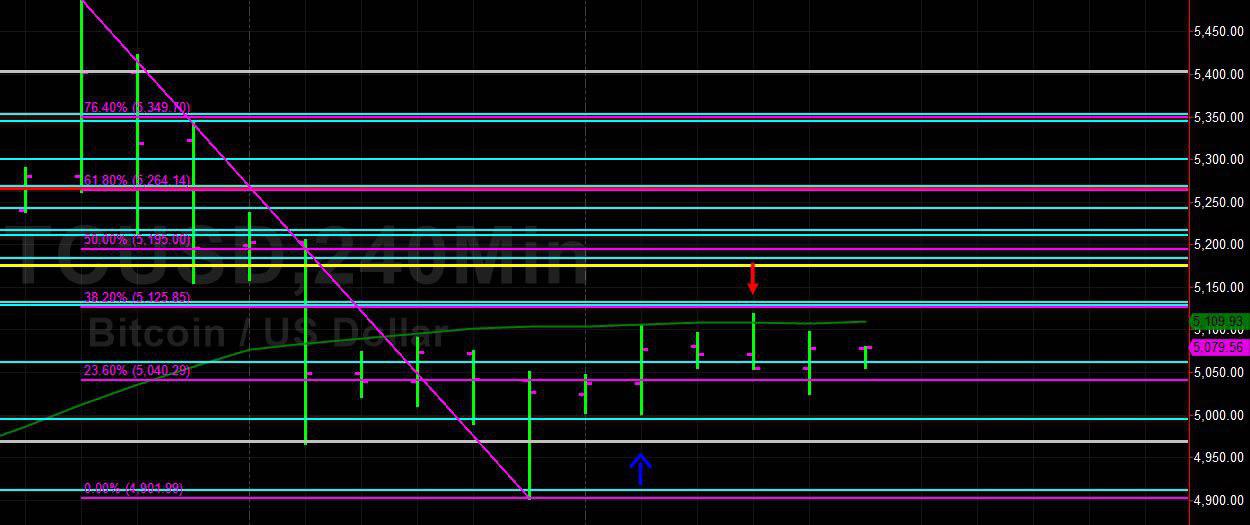
Bitcoin (BTC/USD) continued to struggle with the 50-bar MA (4-hourly) during the past 24 hours and was generally thwarted around the 5105 – 5100 area, barely eclipsing the indicator to briefly trade as high as the 5118.56 area. Traders were probing technical Resistance up to 5125.85 during the move higher, representing the 38.2% retracement of the 5488.00 – 4901.99 range. On the downside, the pair bounced higher from the 5002.39 area during yesterday’s session, right around the 23.6% retracement of the 5345.00 – 4778.00 range.
Chartists are eyeing the 5195.00/ 5264.14 areas as upside technical Resistance with Stops expected above.
Price activity is nearest the 50-bar MA (4-hourly) at 5109.62 and the 50-bar MA (Hourly) at 5096.01.
Technical Support is expected around 4877.05/ 4582.91/ 4393.64 with Stops expected below.
Technical Resistance is expected around 5264.14/ 5403.82/ 5769.98 with Stops expected above.
On 4-Hourly chart, SlowK is Bullishly above SlowD while MACD is Bearishly below MACDAverage.
On 60-minute chart, SlowK is Bearishly below SlowD while MACD is Bullishly above MACDAverage.
Ethereum
Ethereum (ETH/USD) has traded in a very tight range over the last several hours following its test of the technically-relevant 168.47 level yesterday, representing the 61.8% retracement of the 222.78 – 80.60 range. Resistance over the past several hours has come in around the 165.49 area, representing the 23.6% retracement of the 185.62 – 159.27 range, and also right around a larger retracement area related to the move from 302.20 to 80.60.
As we noted in our 11 April 2019 analysis, a Double Top chart pattern is now evident on a 4-hourly chart. Traders are technically curious to see how price activity develops down to the 150.52 area.
As noted in our 12 April 2019 analysis, the 156.53 level is a major downside focal point for traders, representing the 23.6% of the 80.60 – 179.98 range.
Price activity is nearest the 50-bar MA (4-hourly) at 169.55 and the 50-bar MA (Hourly) at 166.30.
Technical Support is expected around the 152.41/ 144.09/ 130.29 levels with Stops expected below.
Technical Resistance is expected around the 172.45/179.40/ 185.62 levels with Stops expected above.
On 4-Hourly chart, SlowK is Bearishly below SlowD while MACD is Bearishly below MACDAverage.
On 60-minute chart, SlowK is Bearishly below SlowD while MACD is Bullishly above MACDAverage.
Litecoin
Litecoin (LTC/USD) wandered lower during today’s Asian session after getting as high as the 81.20 level during yesterday’s North American session. The 80.65 area was subsequently toppish, representing the 23.6% retracement of the 91.99 – 75.33 range, and then more weakness was exhibited during the Asian session when the pair encountered headwinds around the 79.26 area, representing the 23.6% retracement of the 91.99 – 75.33 range.
On the upside, Stops are expected above the 84.71 level and on the downside, Stops are expected below the 72.16 area.
Price activity is nearest the 100-bar MA (4-hourly) at 75.24 and the 50-bar MA (Hourly) at 79.93.
Technical Support is expected around the 72.10/ 67.17/ 65.60 levels with Stops expected below.
Technical Resistance is expected around the 83.94/ 92.56/ 102.26 levels with Stops expected above.
On 4-Hourly chart, SlowK is Bearishly below SlowD while MACD is Bearishly below MACDAverage.
On 60-minute chart, SlowK is Bearishly below SlowD while MACD is Bullishly above MACDAverage.
Bitcoin Cash
BCH/USD (Bitcoin Cash/ US dollar) searched for guidance early in today’s Asian session, taking its cues from yesterday’s North American session when the pair was unable to get back above the 290.00 figure, right around the 38.2% retracement of the move from 638.55 to 73.22. Some Bids emerged around the 271.35 level during today’s Asian session, representing the 38.2% retracement of the 591.88 – 73.22 range.
On the upside, Stops are expected above the 300.75 level and on the downside, Stops are expected below the 265.55 area.
Price activity is nearest the 50-bar MA (4-hourly) at 293.29 and the 50-bar MA (Hourly) at 277.26.
Technical Support is expected around the 265.55/ 229.49/ 206.64 levels with Stops below.
Technical Resistance is expected around the 294.74/ 306.09/ 332.55 levels with Stops above.
On 4-Hourly chart, SlowK is Bullishly above SlowD while MACD is Bearishly below MACDAverage.
On 60-minute chart, SlowK is Bullishly above SlowD while MACD is Bullishly above MACDAverage.