Ethereum (ETH) Likely To Retest $178 Resistance Before Further Sell-Off
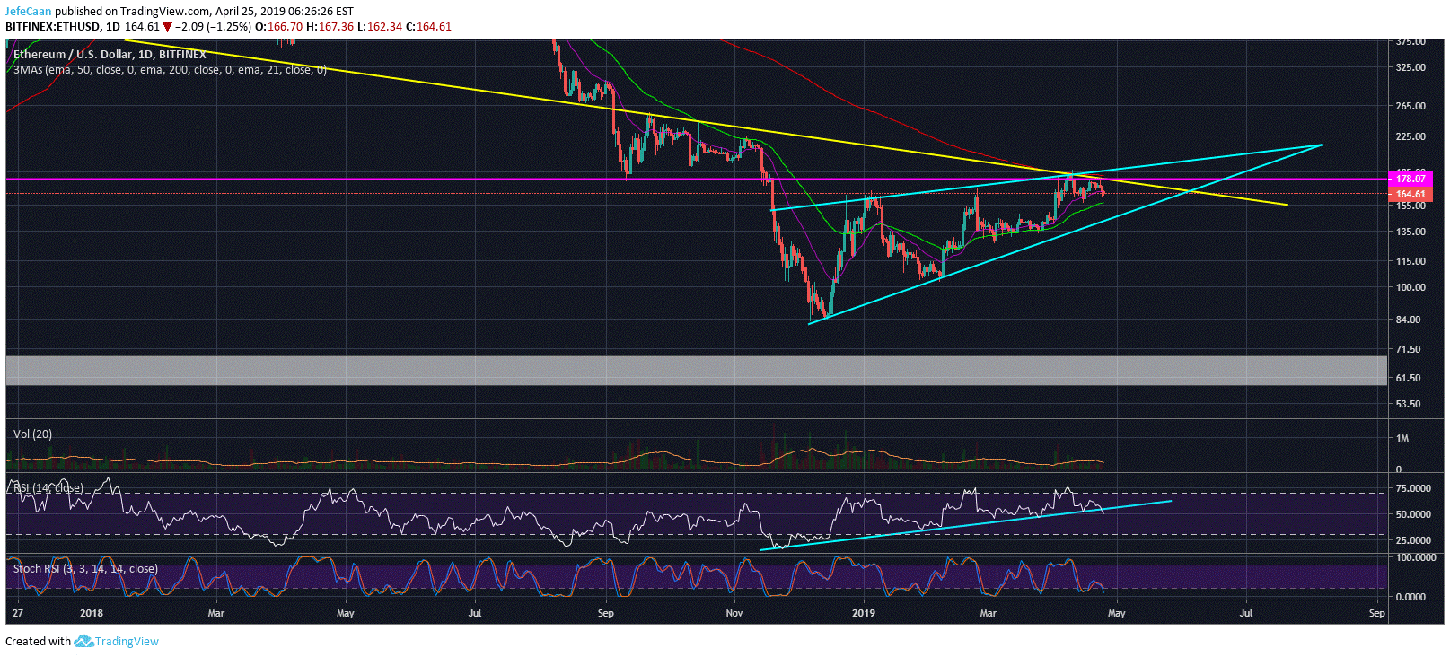
Ethereum (ETH) has seen a massive pullback after a short-lasting move to the upside. However, there still appears to be some room for a rally towards the $178 resistance. The daily chart for ETH/USD shows that this move is not only possible, but also probable. The price of Ethereum (ETH) retraced strongly after it formed a triple top on the 1H chart. This time, the price is expected to form a triple top on the daily chart. This will make for a good setup to short Ethereum (ETH) as the price is heavily overbought on larger time frames. The daily chart shows ETH/USD trading in a rising wedge. This wedge has a very high probability of being broken to the downside sooner or later. The price still has plenty of room to trade within this wedge.
The price might continue to trade sideways with minor movements up and down till the next corrective wave to the downside begins. Ethereum (ETH) unlike Bitcoin (BTC) has already tested the market structure it broke in November, 2018. It could attempt to retest it but that does not seem very likely. Besides, we have seen lately that a rally in BTC/USD does not mean that Ethereum (ETH) has to rally at the same pace or higher. Normally when Bitcoin (BTC) rallies, altcoins like Ethereum (ETH) rally a lot harder. The fact that this is not happening now tells us what exactly is going on. Bitcoin (BTC) is trying to retest its previously broken market structure while trying to push altcoins like Ethereum (ETH) below their critical support levels against Bitcoin (BTC). So, when Bitcoin (BTC) nosedives after a rejection at the previous market structure, most of these altcoins will have nothing to stop them from falling to new lows.
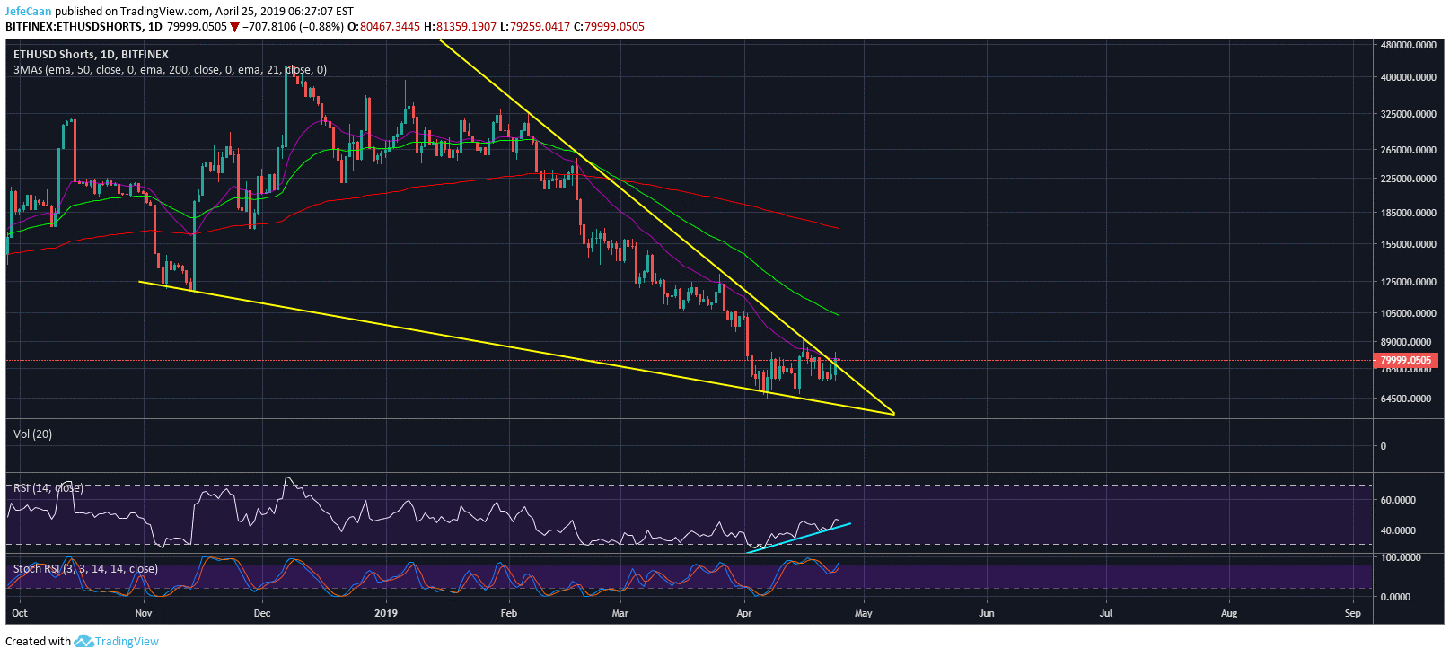
The daily chart for ETHUSDShorts looks nothing like the chart for BTCUSDShorts. This is because Ethereum (ETH) and Bitcoin (BTC) are not on the same level. Ethereum (ETH) is ahead of Bitcoin (BTC) and is now ready for a strong decline whereas Bitcoin (BTC) still has some room for further upside action. Ethereum (ETH) could move up too to retest its previously broken market structure but that does not seem very likely. In fact, the daily chart for ETHUSDShorts shows what is likely. The number of margined shorts is expected to shoot up as ETHUSDShorts has now broken above a large falling wedge.
As the number of margined shorts rises, the sell pressure on Ethereum (ETH) will increase and the price will be expected to decline significantly. We have already discussed in our previous analyses that we see ETH/USD to decline to $60 or lower levels towards the end of the bear market. This could be in the next few months or even next year if the ongoing market cycles takes a lot longer than the previous one. By our calculations, we expect ETH/USD to bottom out by September, 2019 and settle around $60 after reaching its true bottom between $50 and $60.