Published
5 years ago on
March 27, 2019
Bitcoin
Bitcoin (BTC/USD) encountered strong buying pressure during today’s Asian session, with Bulls gunning for the 3980.57 level, representing the 61.8% retracement of the 4056.33 – 3858.00 range. Stops were reached above the 3922.99 area, representing the 100-bar MA on a 4-hourly chart, with further Stops elected above the 3969.94 level, the 50-bar MA. The 3984.88 level is a next major upside target for Bulls, representing the 61.8% retracement of the 4188.79 – 3655.00 range.
Today’s intraday gains were reached after price activity managed to remain above the 200-bar MA (3873.11) yesterday following a test on 25 March.
Technical Support is expected around 3815.17/ 3763.33/ 3684.13/ 3620.14 with Stops expected below.
Technical Resistance is expected around 4062.82/ 4111.39/ 4188.79/ 4239.37 with Stops expected above.
Upside price objectives remain around the 4163/ 4358/ 4673 levels.
On 240-minute chart, SlowK has Bullishly moved above SlowD while MACD has Bullishly crossed above MACDAverage.
On 60-minute chart, Price activity climbed above the 200-bar MA (3970.10) and is seeking to establish a base above this area. SlowK is Bullishly above SlowD while MACD is Bullishly above MACDAverage.
Ethereum
Ethereum (ETH/USD) found Bids during today’s Asian session, easily moving through technical Resistance at the 50-bar MA (135.83) and 200-bar MA (135.17) with some Stops reached above. Key technical Support eventually emerged around the 132.87 area, representing the 23.6% retracement of the 165.62 – 122.75 range. Minor Stops were also reached above the 136.98 level, representing the 50% retracement of the 147.23 – 130.64 range.
Technical Support is expected around the 129.34/ 128.53/ 126.82 levels with Stops expected below.
Technical Resistance is expected around the 137.52/ 140.61/ 141.45/ 143.05 levels with Stops expected above.
Downside price objectives remain around the 119.57 level.
On 240-minute chart, SlowK has Bullishly crossed above SlowD while MACD has Bullishly crossed above MACDAverage.
On 60-minute chart, Price activity has established a base above the 200-bar MA (135.82). SlowK and SlowD have converged and MACD is Bullishly above MACDAverage.
Litecoin
Litecoin (LTC/USD) raced higher during today’s Asian session with traders lifting the pair as high as the 60.20 level. A flurry of Stops were reached above the 50-bar MA (59.12) on a 4-hourly chart. Technicians pushed LTC/USD higher to test the 60.15 level, an important level identified in our 26 March 2019 analysis that represents the 61.8% retracement of the 62.22 – 56.80 range. Further strength would see traders eye the 60.94 level, representing the 76.4% retracement of the same range.
Technical Support is expected around the 57.54/ 54.48/ 48.33 levels with Stops expected below.
Technical Resistance is expected around the 60.94/ 62.09/ 66.80 levels with Stops expected above.
Upside price objectives remain 74 level.
On 240-minute chart, SlowK is Bullishly above SlowD while MACD has Bearishly crossed above MACDAverage.
On 60-minute chart, Price activity is nearest the 100-bar MA (59.19). SlowK and SlowD have converged while MACD remains Bullishly above MACDAverage.
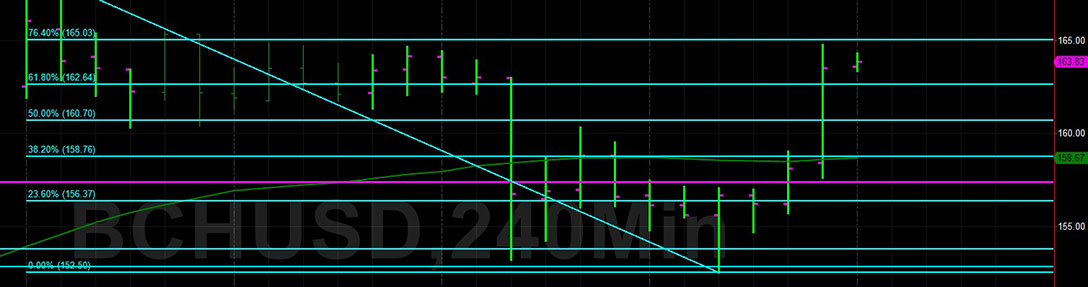
Bitcoin Cash
BCH/USD (Bitcoin Cash/ US dollar) rocketed higher during the Asian session today as traders were eventually able to absorb Offers around the 50-bar MA (158.60) on a 4-hourly chart. Stops were elected above the 162.64 level, representing the 61.8% retracement of the 168.90 – 152.50 range. The next big technical hurdle for the pair remains the 165.03 level, representing the 76.4% retracement of the same range, above which Stops are anticipated.
Technical Support is expected around the 152.83/ 150.87/ 145.95 levels with Stops below.
Technical Resistance is expected around the 168.90/ 171.62/ 186.47 levels with Stops above.
Downside price objectives remain the 110 and 82 levels.
On 240-minute chart, SlowK is Bullishly above SlowD while MACD has Bullishly crossed above MACDAverage.
On 60-minute chart, Price activity is below the 200-bar MA (161.16). SlowK and SlowD have converged and MACD has Bullishly crossed above MACDAverage.
Investment Disclaimer