Published
5 years ago on
March 26, 2019
Bitcoin
Bitcoin (BTC/USD) depreciated to key technical Support that we exactly identified in our 24 March 2019 analysis, testing the 3858.00 figure after Stops were elected below the 3933.65 level, then the 100-bar MA on a 4-hourly chart. Stops were also triggered below the 3921 area, representing the 50% retracement of the 4188.79 – 3655.00 range, and also below the 200-bar MA (3889.47) on a 4-hourly chart. A pullback was seen early in the Asian session with traders again eyeing the 3921 level.
Additional BTC/USD weakness will spotlight the 3815 level, representing the 38.2% retracement of the 3128.99 – 4239.37 range, followed by the 3771.89 area, representing the 50% retracement of the 4414.89 – 3128.89 range.
Technical Support is expected around 3815.17/ 3763.33/ 3684.13/ 3620.14 with Stops expected below.
Technical Resistance is expected around 4062.82/ 4111.39/ 4188.79/ 4239.37 with Stops expected above.
Upside price objectives remain around the 4163/ 4358/ 4673 levels.
On 240-minute chart, Price activity is trading between the 100-bar MA (3933.88) and the 200-bar MA (3889.34). SlowK has Bullishly moved above SlowD while MACD remains Bearishly below MACDAverage.
On 60-minute chart, Price activity remains below the 50-bar MA (3954.86). SlowK is Bullishly above SlowD while MACD and MACDAverage are Bullishly converging.
Ethereum
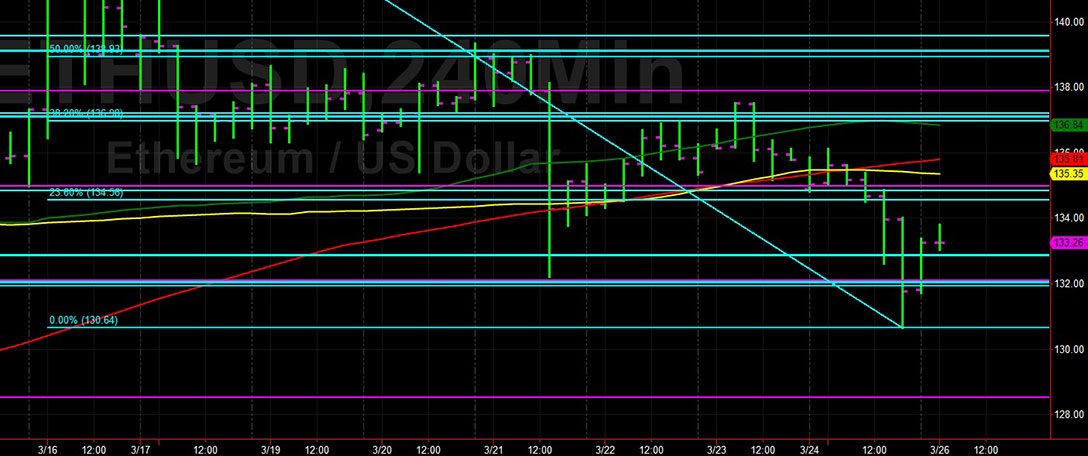
Ethereum (ETH/USD) reclaimed some lost ground during the Asian session after traders took out Stops below the 132.87 level as identified in our 24 March 2019 analysis. The pair got as Low as the 130.64 level before moving higher and seeking to establish a base around the 132.87 area. On a 4-hourly chart, the 100-bar MA is coming in around 135.31, leading to some speculation it could be tested if the 134.99 area is absorbed, representing the 50% retracement of the move from 122.75 to 147.23.
Technical Support is expected around the 129.34/ 128.53/ 126.82 levels with Stops expected below.
Technical Resistance is expected around the 137.52/ 140.61/ 141.45/ 143.05 levels with Stops expected above.
Downside price objectives remain around the 119.57 level.
On 240-minute chart, SlowK has Bullishly crossed above SlowD while MACD remains Bearishly below MACDAverage.
On 60-minute chart, Price activity is nearest the 50-bar MA (134.75). SlowK is Bullishly above SlowD while MACD has Bullishly crossed above MACDAverage.
Litecoin
Litecoin (LTC/USD) searched for fresh conviction after traders were able to trigger some light Stops below the 58.08 level, representing the 23.6% retracement of the move from 62.22 to 56.80. Stops were also reached below the 58.04 level, the 100-bar MA on a 4-hourly chart. Technicians are eyeing the 58.87 level on a move higher, representing the 38.2% retracement of the 62.22 – 56.80 range.
Technical Support is expected around the 57.54/ 54.48/ 48.33 levels with Stops expected below.
Technical Resistance is expected around the 60.15/ 62.09/ 66.80 levels with Stops expected above.
Upside price objectives remain 74 level.
On 240-minute chart, the 50-bar MA is now around 59.19. SlowK and SlowD have Bearishly converged while MACD is Bearishly below MACDAverage.
On 60-minute chart, Price activity is trading below the 50-bar MA (59.15). SlowK has Bearishly crossed below SlowD while MACD and MACDAverage are converging.
Bitcoin Cash
BCH/USD (Bitcoin Cash/ US dollar) orbited some key technical levels during the Asian session after yesterday testing key technical Support around the 153.21 level, right around the 38.2% retracement of the 232.10 – 104.80 range and just above the key 152.83 technical Support level identified in our 24 March 2019 commentary. The pair continues to hug the 158.72 level, representing the 50-bar MA on a 4-hourly chart.
Technical Support is expected around the 152.83/ 150.87/ 145.95 levels with Stops below.
Technical Resistance is expected around the 171.62/ 186.47/ 194.60 levels with Stops above.
Downside price objectives remain the 110 and 82 levels.
On 240-minute chart, SlowK and SlowD are converging and MACD remains Bearishly below MACDAverage.
On 60-minute chart, Price activity is below the 200-bar MA (158.80). SlowK is Bearishly diverging from SlowD and MACD has Bearishly crossed below MACDAverage.
Investment Disclaimer