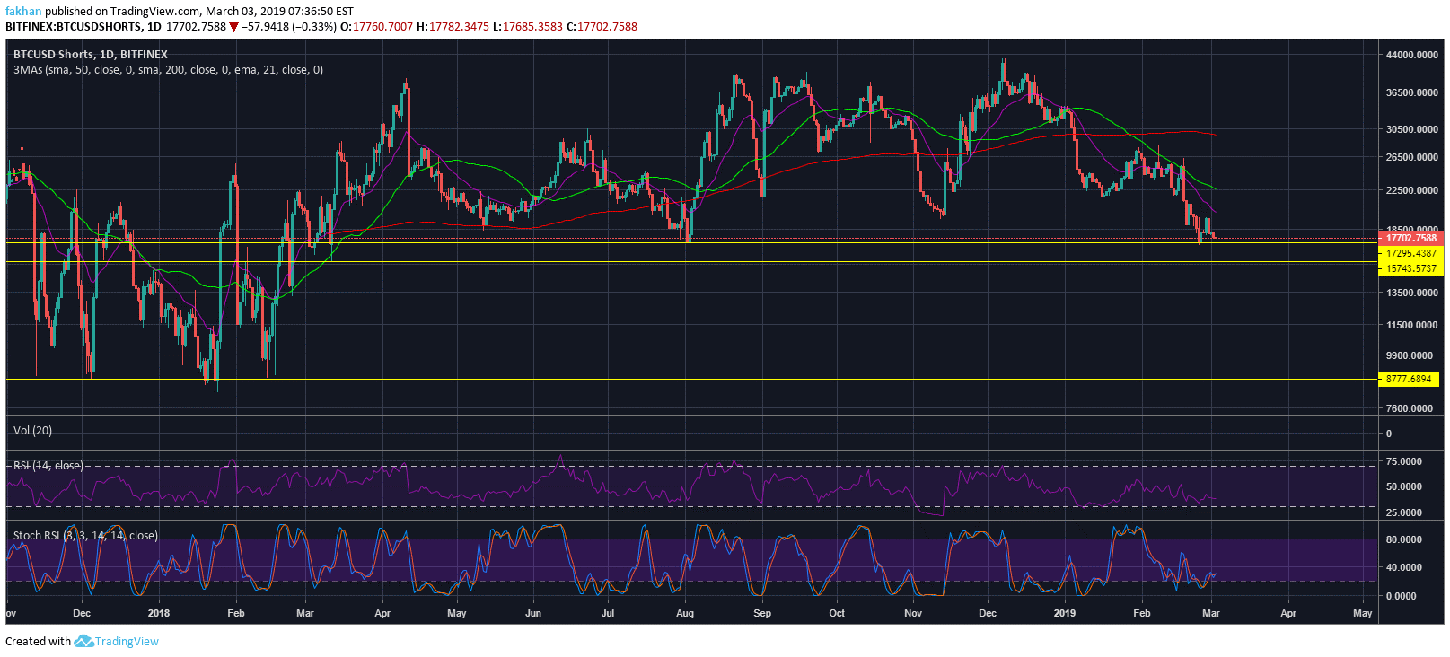
Bitcoin (BTC) is going down but not before it goes up first. If we look at the daily chart for BTCUSDShorts, we can see that the number of margined shorts has declined back towards the previous support. At the same time, conditions are ripe for a strong rally to the upside in BTC/USD. In order to trigger that rally to the upside, the sell pressure has to decline more which is why we expect the current support for BTCUSDShorts to be broken. That will hurt the bearish resolve short term and allow for a strong rally in BTC/USD towards $4,500. In some of our previous analyses we have mentioned that this rally could go as high as $5,000 but the probability of that happening based on current outlook is low.
At this point in time, the market is looking for somebody to step in and take the lead. The bears know the price is going to fall but they are afraid to pull it down from current levels especially when BTC/USD is already trading under oversold conditions on the daily time frame. The bulls just witnessed what can happen if they get too excited. This happened last week when entire weekly gains were wiped out in a matter of hours on the weekend. So, the bulls do know that conditions are ripe for a rally to the upside but they are afraid to step in just yet. They need the sell pressure to come down first before they can get onboard. This is where the whales come in.
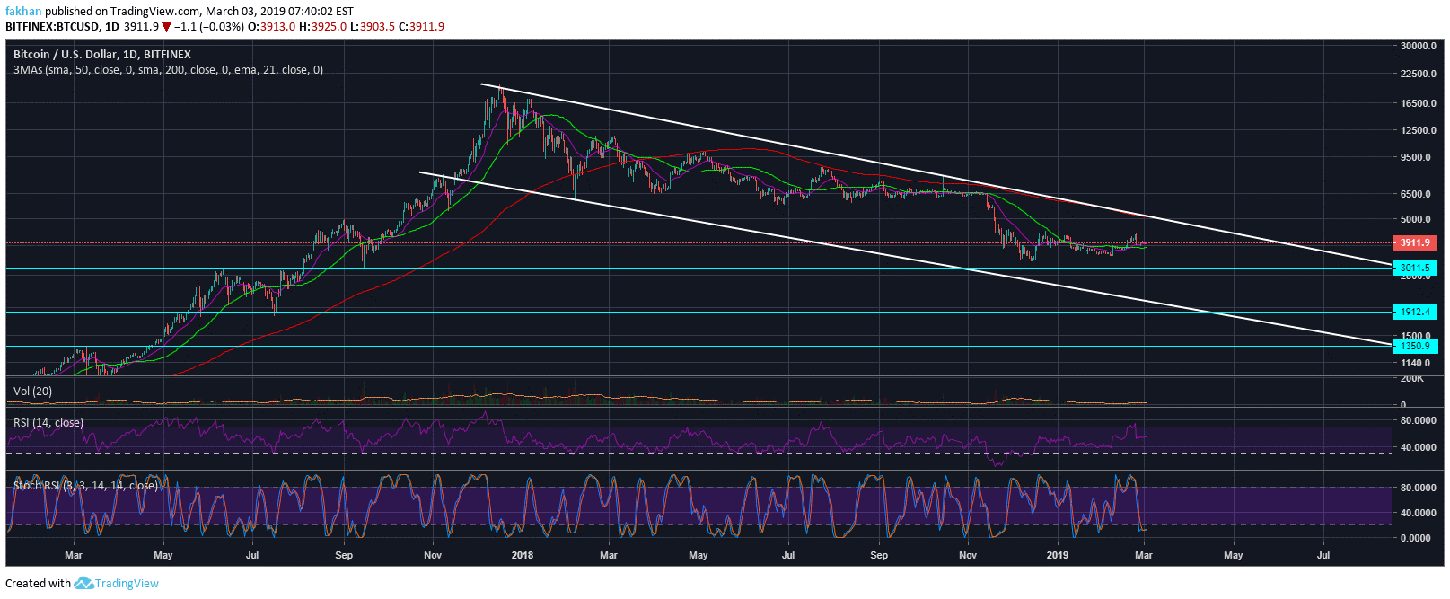
Over the next few days, we expect the whales would trigger a pump to the upside which would force Bitcoin (BTC) bears to close their margined shorts for now. This decline in sell pressure would be exploited by the bulls to fuel that rally towards $4,500. If we look at the daily chart for BTC/USD, we can see that Bitcoin (BTC) has been in a long descending channel since the beginning of the correction. This is a very simple and straightforward view and in trading it is often helpful to keep things as simple as possible. Anyone who had drawn these trend lines and realized that BTC/USD had been trading in a descending channel would have been able to tell where to buy and where to sell. As the chart shows, October, 2018 was the time when BTC/USD was about to hit the top of the descending channel and this is why we saw the massive decline in price as most traders cashed out.
When the price found a temporary bottom in December, 2018, we saw a rally to the upside but it is becoming increasingly clear that this rally is in no mood for a strong move to the upside. We expected that to be the case because BTC/USD has not touched the bottom of the descending channel yet. Previously, it had the opportunity to test the bottom of this channel around $3,000 but now that opportunity is gone. When BTC/USD declines again, it will have to fall a lot lower than $3,000 to touch the bottom of this channel. If the drop is aggressive and a lot steeper than the previous crash, we might be lucky to see BTC/USD find its true bottom around $1,900. If the drop is not immediate and aggressive in nature, we will see a decline towards $1,300 which we consider to be the worst case scenario.