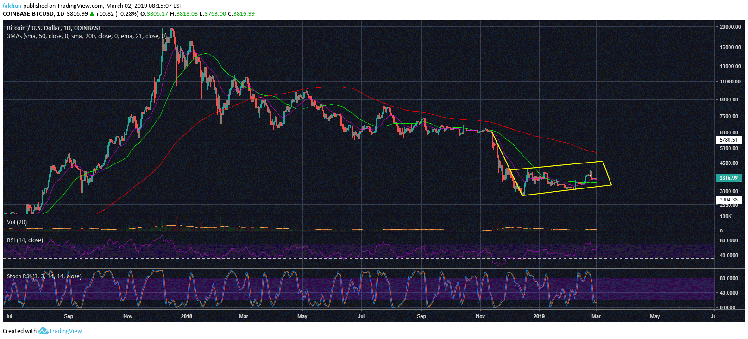
Bitcoin (BTC) is about to complete a major bear flag but the majority of investors seem unconcerned by what it means. A lot of Bitcoin (BTC) traders and investors are focused on the potential golden cross that might form if the 50 day moving average crosses above the 200 day moving average. However, they ignore the bear flag that we have seen form between November, 2018 and now. The daily chart shows that BTC/USD is currently trading above the 50 day moving average which is a good sign. Furthermore, the price could end up shooting towards the top of the bear flag in the days ahead to complete the bear flag. It is also possible that Bitcoin (BTC) might test the 200 day moving average around that time.
So far, the near term outlook looks very positive for BTC/USD and we could expected a rally towards $4,500 in the days ahead. A lot of long term bears do not consider that a possibility but we believe that the price is due for a short term correction to the downside. A lot of bulls are still hoping the price could shoot up from here because they believe Bitcoin (BTC) has already bottomed. In our previous analyses, we have said that BTC/USD is extremely unlikely to have bottomed without a retest of the support near $3,000. So far, we have not seen that level being tested and it is extremely likely that the price will have to come down to test that level in the days and weeks ahead.
Volume has started to decline on the daily time frame which means this is not a good time to be entering margined positions especially long positions for that short term gain to the upside. The probability of a move to the upside remains high but it could be a quick move to the upside followed by a strong rejection which means buyers may not be able to get out of their positions as quickly as they want to and the whales would dump their coins on them. So, it is important to have a strategy here. While we do believe that BTC/USD might decline further to reach a price of $3,000 or lower, let us not forget that Bitcoin (BTC) is down all the way from almost $20,000. We also know that it is extremely likely to rise a lot higher in price in the months ahead.
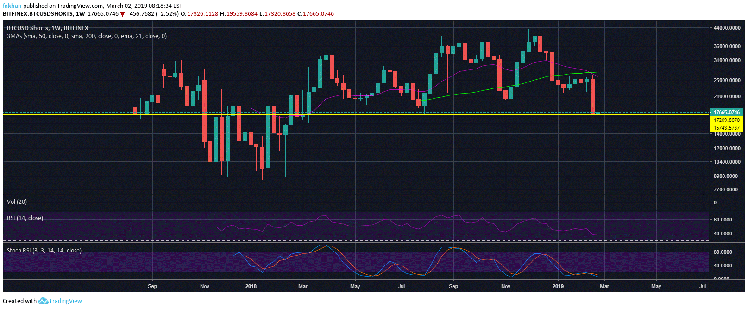
The weekly chart for BTCUSDShorts shows that there is significant room for further downside as the number of shorts is expected to rise in the weeks ahead. That being said, we might expect the price of Bitcoin (BTC) to rise first during which time the number of shorts is expected to continue to decline. If the weekly candle for BTCUSDShorts closes in its current state that will be very bullish for the price of Bitcoin (BTC). In that case, we may expect BTC/USD to rise as high as $5,000 short term and the number of margined shorts might decline significantly all the way down to the support around 8,000.