Bitcoin (BTC) Volatility Index Shows The Bottom Is Either In Or Very Close
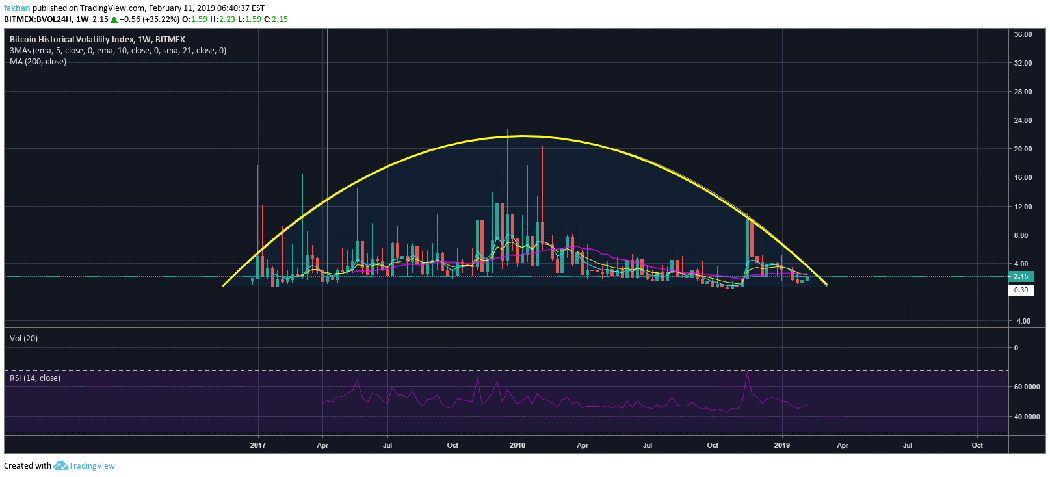
Bitcoin (BTC) has recently convinced the majority of traders and analysts that the bearish momentum that has prevailed over the past few weeks has suddenly disappeared. The crypto fear and greed index is once again hovering near 40 which means that the sentiment is mildly bearish and it would not take much to turn the tables on Bitcoin (BTC) bears. The weekly chart for Bitcoin Historical Volatility Index shows that Bitcoin (BTC) is about to complete a volatility cycle that started in late 2016 and ended in early 2019. We saw the major spikes in volatility at the climax of the bull run when the price was making double digit moves every day. Since November, 2018 the volatility has declined significantly and is now close to historical lows. That being said, this cycle is about to reach completion and soon as the volatility index climbs above the 21 Week EMA, we might see an aggressive rise in the price of Bitcoin (BTC).
There is a good chance that Bitcoin (BTC) may not have found a global bottom yet and the price may decline a lot more in the months ahead. However, it is clear that BTC/USD has found a local bottom and a very strong one. The price is extremely unlikely to fall below this local bottom before a retest of the previous market structure. If the price ends up rallying past the previous market structure, then that should be confirmation that we have indeed bottomed. Either way, a retest of the previous market structure is needed before the price can continue lower or higher. The volatility index is currently hovering around its mean but we could see a break out in the days and weeks ahead as Bitcoin (BTC) prepares to retest previous market structure.
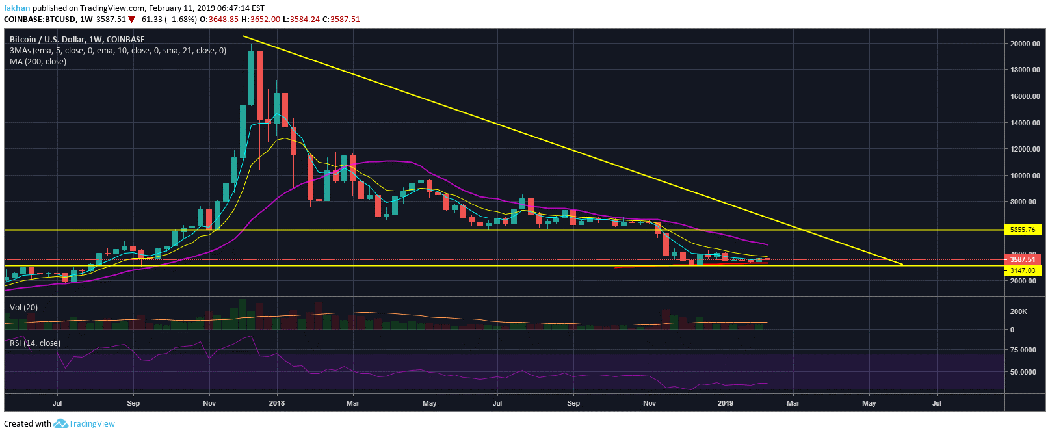
The weekly chart for BTC/USD shows that the price has found a solid support above the 200 Week MA. There is a very strong probability that this is indeed the bottom and we may be continuing higher from that. Even if Bitcoin (BTC) were to fall lower after facing rejection at the previous market structure, I don’t think it is likely that BTC/USD will close below the 200 Week MA. This is because that has never been done and if it happens for the first time, the sentiment is likely to turn long term bearish. Please note that the sentiment is currently long term bullish. A lot of traders and analysts that expect the price to fall to a certain level short term expect it to rise to a new all-time high long term.
However, if BTC/USD falls and closes below the 200 Week MA there might be some serious repercussions. A break and close below the 200 Week MA is a strong indicator of bearish continuation and often leads to significant further downside. In that case, it may not be surprising to see a triple digit Bitcoin (BTC) price. Moreover, the price will continue to struggle with previous support turned resistance levels even as the next halvening approaches. Considering that we have not seen something like this happen in Bitcoin (BTC)’s entire trading history, it would be reasonable to assume that BTC/USD may drop below the 200 Week MA but it will end up closing above it. In that case, a significant decline below the 200 Week MA cannot be expected which means now is a good time to start accumulating.