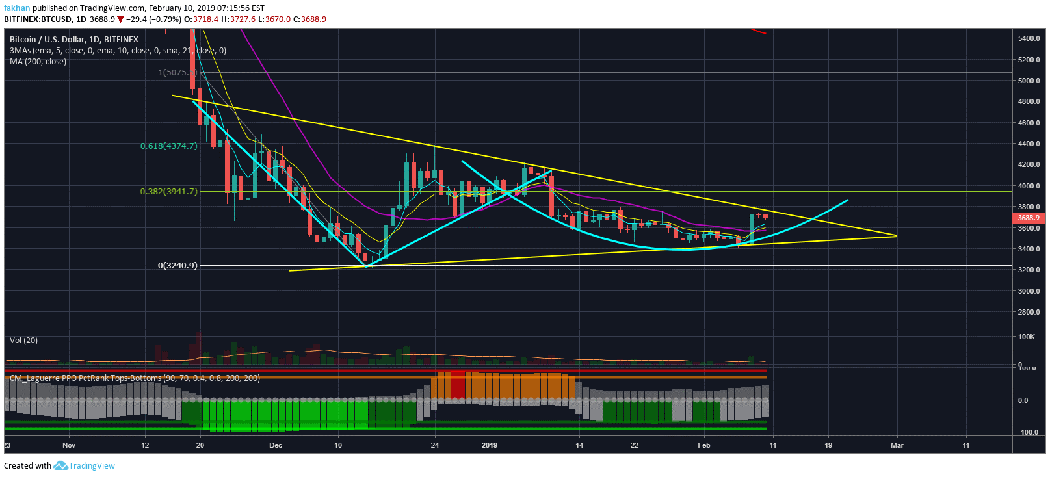
Bitcoin (BTC) bulls have come up with a lot of bullish setups that could play out in the weeks and months ahead. However, as long as BTC/USD remains below the trend line resistance, all bets are off. Yesterday’s daily candle closed below the trend line resistance after facing strong rejection. Today’s daily candle has already declined below yesterday’s candle and it is now clear that the price may decline towards the 21 Day EMA in the days ahead. That being said, there is no reason to look for bearish entries at this point as the risk/reward is not favorable. Bitcoin (BTC) has had an extensive correction and the price has found a local bottom. We do not know yet if this is the ultimate bottom but what we do know is that the price will have to correct to the upside first before it can fall lower.
It surprises me to see that a lot of professional traders who are very good with charting and risk management often downplay the effects of human psychology in trading. Many professional traders are good with coming up with very detailed charts that highlight all sorts of scenarios but the problem lies in interpretation. Any computer software or algorithm can come up with possibilities and outcomes to execute with perfection, but the reason they have not beaten humans at their own game is because they do not have the ability to think. A lot of people can come up with interesting patterns and trends as to where they think the price could be headed next. However, very few can properly analyze the probabilities of those outcomes. It is a problem we are seeing more and more in this space as people are rushing to provide information without understanding the subject matter themselves.
Recently, Tom Lee of Fundstrat who earlier predicted Bitcoin (BTC) at $25,000 by December, 2018 has now set a target of $2,270 for BTC/USD in Q1 of 2019. This prediction might be as hard to come true as the previous one. The reason I say that is because a fall to $2,270 has a very small probability of being a flash crash. In other words, if the price were to fall to $2,270, it would have to close below the 200 Week MA and not just fall below it. We have seen flash crashes below the 200 Week MA in the past but we have not seen a close below the 200 Week MA in the entire trading history of Bitcoin (BTC). If there is anything we have learnt following Bitcoin (BTC) throughout its long boring bear trend is that the BTC/USD chart is just one piece of the puzzle.
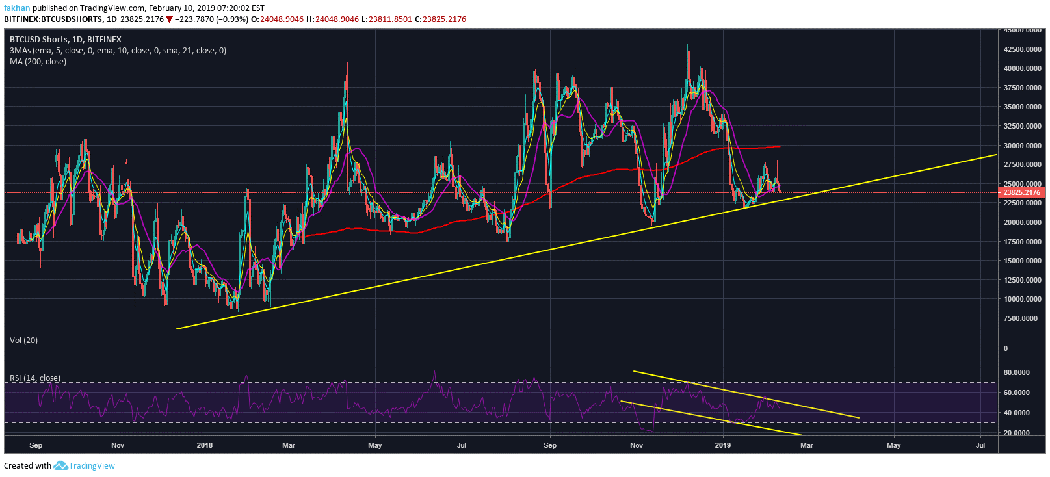
There are other important charts that give us valuable insights as to the future outlook of Bitcoin (BTC). One of such charts is the number of open short positions on exchanges. The daily chart for BTCUSDShorts has historically been a good indicator of the strength of sell pressure on Bitcoin (BTC). When the number of shorts declined heavily in November, 2017 that was when we saw most cryptocurrencies rally aggressively against the US Dollar (USD). Similarly, when the number of shorts started to spike in early 2018 that is when we saw the bear trend begin. The trend line support that BTCUSDShorts is trading on has not been broken once. However, the probability of it being broken this time is higher than ever as BTCUSDShorts has closed below both the 200 Day MA and the 21 Day EMA. If this trend line support breaks, BTC/USD could climb above $6,000 in a matter of days.