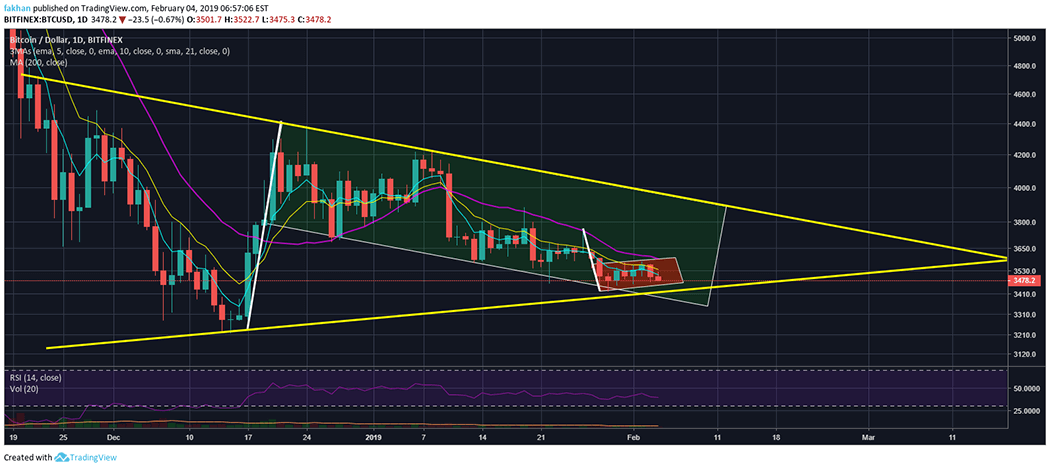
Bitcoin (BTC) bulls failed to assume control even though market conditions were in their favor. This led to the bears getting confident enough to turn the tables on them. The major bull flag seen on the daily chart for BTC/USD seems to have turned into a small bear flag just around the bottom of the symmetrical triangle. This bear flag has now introduced a new setup that has once again increased the probability of a break to the downside. Even though the possibility of a bullish breakout is still a lot higher than that of a bearish breakout but now the difference in probabilities has been significantly bridged. The price of Bitcoin (BTC) is still trading within the major bull flag and has not invalidated it yet but the longer we stay close to the bottom of the symmetrical triangle, the more we risk a break to the downside.
It is surprising to see that the bulls are still reluctant to step up when circumstances to push for a bullish breakout have never been better. At this point, given the low volume BTC/USD would not take much to break and close above the 21 Day EMA. Once that happens, it is game over for the bears. As we have mentioned in our previous analyses this break and close above the 21 Day EMA would resemble the second break and close below the 21 Day EMA when the price had topped out. This means that the moment BTC/USD breaks and closes above the 21 Day EMA, we will have a confirmation that the bear trend is formally over. It may still take time for the price to regain its bullish momentum and stage a bullish comeback but at least Bitcoin (BTC) would be out of the woods and investors can rest assured that this was indeed the bottom.
At this point, when the sentiment is overly bearish it might seem hard to believe that we have either bottomed out or are very close to bottoming out. However, if we analyze facts instead of sentiments, we can see that it is in fact the cold hard truth. I know there are a lot of people in this market who bought near the top and sold at major losses. They desperately want the price to fall further so they can recoup their losses and regain the number of coins that they lost. However, when the majority of mainstream investors bet on the same outcome, the opposite happens most of the time.
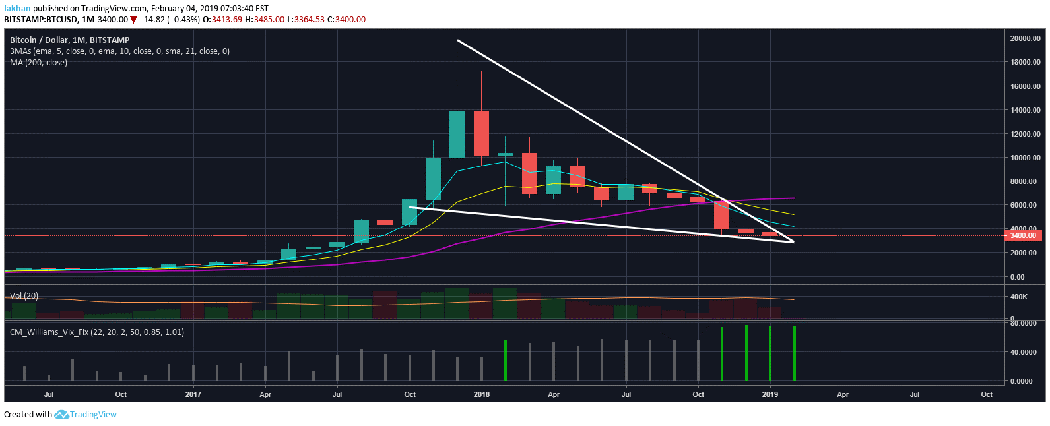
In this case, the monthly chart for BTC/USD shows that we are currently at a very interesting point. The VIX indicator on the monthly chart first showed a green bar for BTC/USD next to February, 2018. This was an indication of a local bottom and we saw the price recover enormously from its lows during that month. When the price continued to decline in March, 2018 we never saw any green bar next to the monthly candles until the month of November, 2018. This was a strong indication that the local bottom was in but we were still not sure if it was the global bottom. Now, we are back in February and the indicator has printed another green bar as part of a series of four consecutive green bars.
When the first green bar appeared on the VIX indicator in February, 2018 it was not followed by any consecutive bars. However, the fact that the current green bar this month is preceded by three other consecutive bars confirms the fact that we have either bottomed out or are very close to bottoming out. Either way, there is not much room for further downside. While margin positions may not be a good idea yet, accumulating for long term may be the best course of action for the risk taking enthusiasts while patience would be the better option for the risk averse.