Published
1 month ago on
March 26, 2024
Table of Contents
- Ethereum trading volume is up 58% in 24 hours.
- Daily RSI stands at 54, indicating a neutral condition.
Ethereum has recently witnessed a surge in bullish activity, signaling a promising path to recovery. Over the past 24 hours, ETH witnessed a commendable 4% upswing in its price, with figures climbing from $3434 to $3657. Notably, this bullish momentum was accompanied by a significant spike in trading volume, which surged by an impressive 58%, peaking at $19 billion.
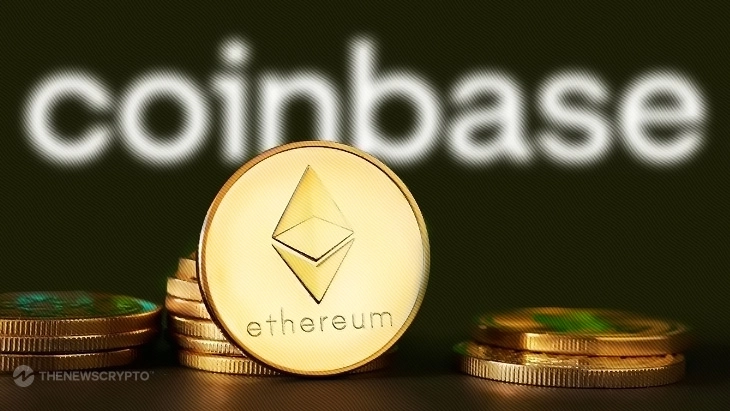
However, amidst this flurry of activity, a notable transaction caught the attention of the crypto community. A substantial transfer of 150,000 ETH, equivalent to a staggering $541,723,713, from an undisclosed wallet to Coinbase, sent ripples of speculation throughout the market.
— Whale Alert (@whale_alert) March 26, 2024


150,000 #ETH (541,723,713 USD) transferred from unknown wallet to #Coinbasehttps://t.co/ffDgYNoAg3
While the origins and intentions behind this transaction remain shrouded in mystery, some speculators have raised eyebrows, suggesting possible involvement from Ethereum co-founder and luminary figure, Vitalik Buterin. Although lacking official confirmation, analysts have proposed various hypotheses, ranging from staking endeavors to potential market manipulation strategies.
Where ETH Headed?
Despite the ongoing fluctuations in the crypto sphere since the onset of 2024, there is undeniable evidence of several notable bull rallies. Bitcoin, for instance, recently soared past the $73.5K mark. Then it encountered a brief bearish interlude before resuming its ascent beyond $70K. In contrast, Ethereum’s trajectory appears more gradual, with the currency still trailing approximately 26% below its all-time high. Nevertheless, the community remains eagerly poised for significant developments within the Ethereum ecosystem.
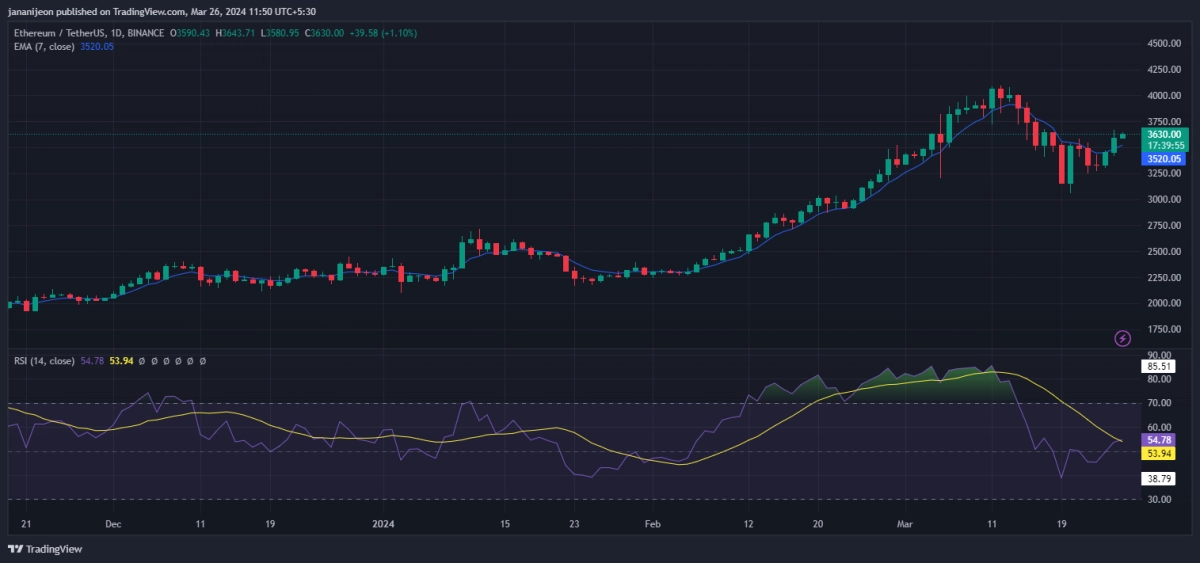
Technical indicators further illuminate the current state of affairs in Ethereum’s market dynamics. The 7-day Exponential Moving Average (EMA) stands at $3520, hinting at a cautiously optimistic yet potentially volatile bullish trend. Additionally, the daily Relative Strength Index (RSI) registers at 54, reflecting a neutral sentiment among traders.
As Ethereum navigates through the intricacies of the digital asset landscape, investors and enthusiasts alike remain vigilant, anticipating the next decisive moves that will shape its future.
Disclaimer: This article is provided for informational purposes only. It is not offered or intended to be used as legal, tax, investment, financial, or other advice.
Read on TheNewsCrypto Investment Disclaimer