
Published
1 week ago on
April 19, 2024

BNB price is attempting a fresh increase from the $515 zone. The price could gain bullish momentum if it clears the $572 resistance zone.
After a downside correction below $550, BNB price found support near the $515 zone. A low was formed at $513.6 and the price started a recovery wave, like Ethereum and Bitcoin.
There was a move above the $525 and $530 resistance levels. The bulls pushed the price above the $540 pivot level and the 23.6% Fib retracement level of the downward move from the $630 swing high to the $513 low. There was also a break above a key bearish trend line with resistance at $540 on the 4-hour chart of the BNB/USD pair.
The price is still trading below $550 and the 100 simple moving average (4 hours). Immediate resistance is near the $555 level. The next resistance sits near the $572 level or the 50% Fib retracement level of the downward move from the $630 swing high to the $513 low.
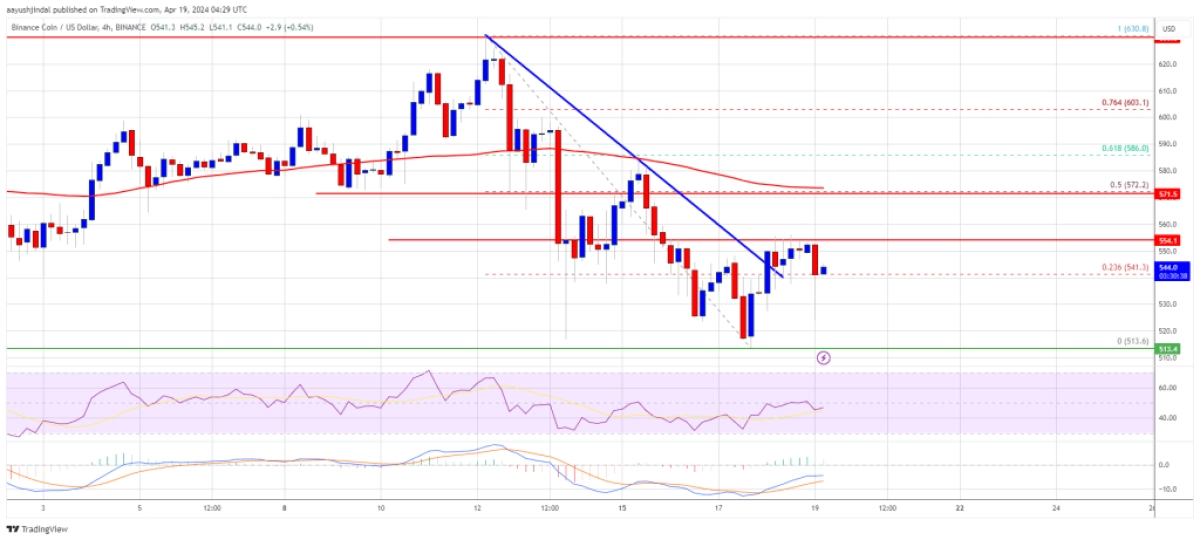
Source: BNBUSD on TradingView.com
A clear move above the $572 zone could send the price further higher. In the stated case, BNB price could test $600. A close above the $600 resistance might set the pace for a larger increase toward the $630 resistance. Any more gains might call for a test of the $650 level in the coming days.
If BNB fails to clear the $572 resistance, it could start another decline. Initial support on the downside is near the $532 level.
The next major support is near the $520 level. The main support sits at $515. If there is a downside break below the $515 support, the price could drop toward the $500 support. Any more losses could initiate a larger decline toward the $465 level.
Technical Indicators
4-Hours MACD – The MACD for BNB/USD is losing pace in the bullish zone.
4-Hours RSI (Relative Strength Index) – The RSI for BNB/USD is currently below the 50 level.
Major Support Levels – $532, $520, and $515.
Major Resistance Levels – $555, $572, and $600.
Disclaimer: This article is provided for informational purposes only. It is not offered or intended to be used as legal, tax, investment, financial, or other advice.
Read on NewsBTC Investment Disclaimer