
Published
1 week ago on
April 25, 2024
Bitcoin’s price has failed to continue its rally beyond the $75K level and has been consolidating over the past few weeks. Yet, sooner or later, the direction of the next major move will be determined.
By TradingRage
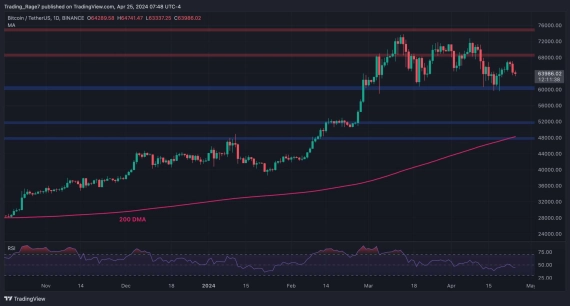
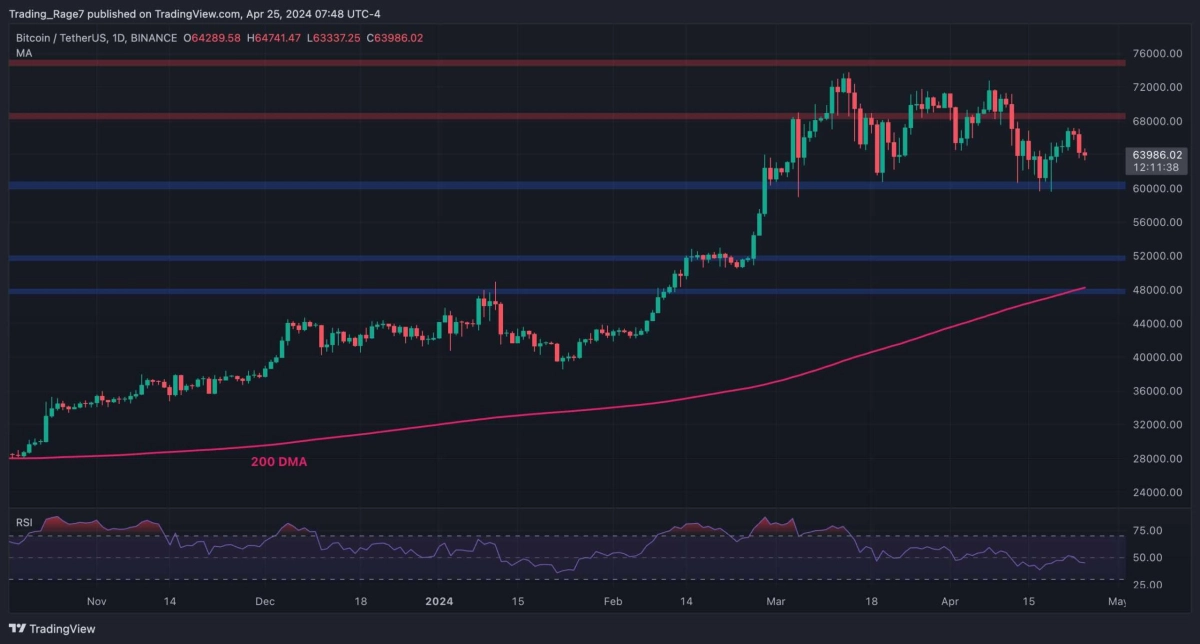
On the daily chart, the price still ranges between the $60K and $70K levels, failing to break to either side. The Relative Strength Index has also been hovering around the 50% mark, pointing to an equilibrium in momentum.
The BTC price is seemingly dropping back toward the $60K support zone. In this case, the level would likely finally break down, and the cryptocurrency could experience a massive drop down to the $52K area. On the other hand, if the market climbs above the $70K level, a new all-time high would be imminent.
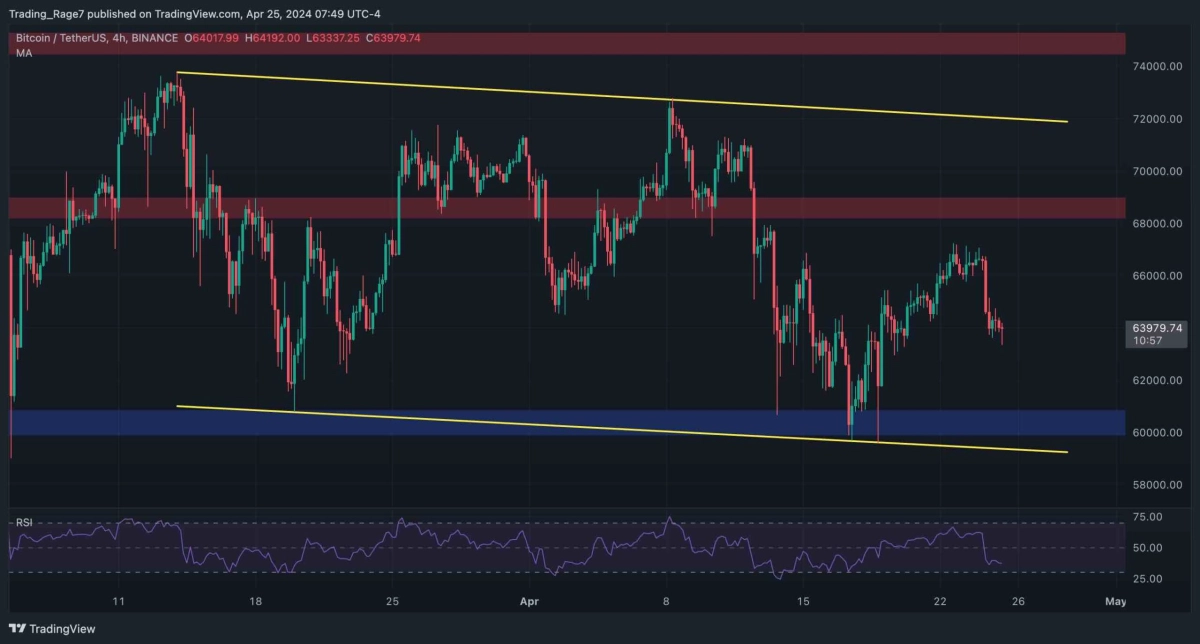
The 4-hour chart shows a very choppy price action, as BTC has been forming a large descending channel pattern since March. The cryptocurrency has recently rebounded from the lower boundary of the pattern but is seemingly dropping back toward it once more.
The RSI is also showing values below 50% in this timeframe, suggesting that the 4-hour momentum is bearish. Either way, while a bullish move typically follows a descending channel pattern, its breakdown is usually catastrophic and is followed by a significant selloff.
By TradingRage
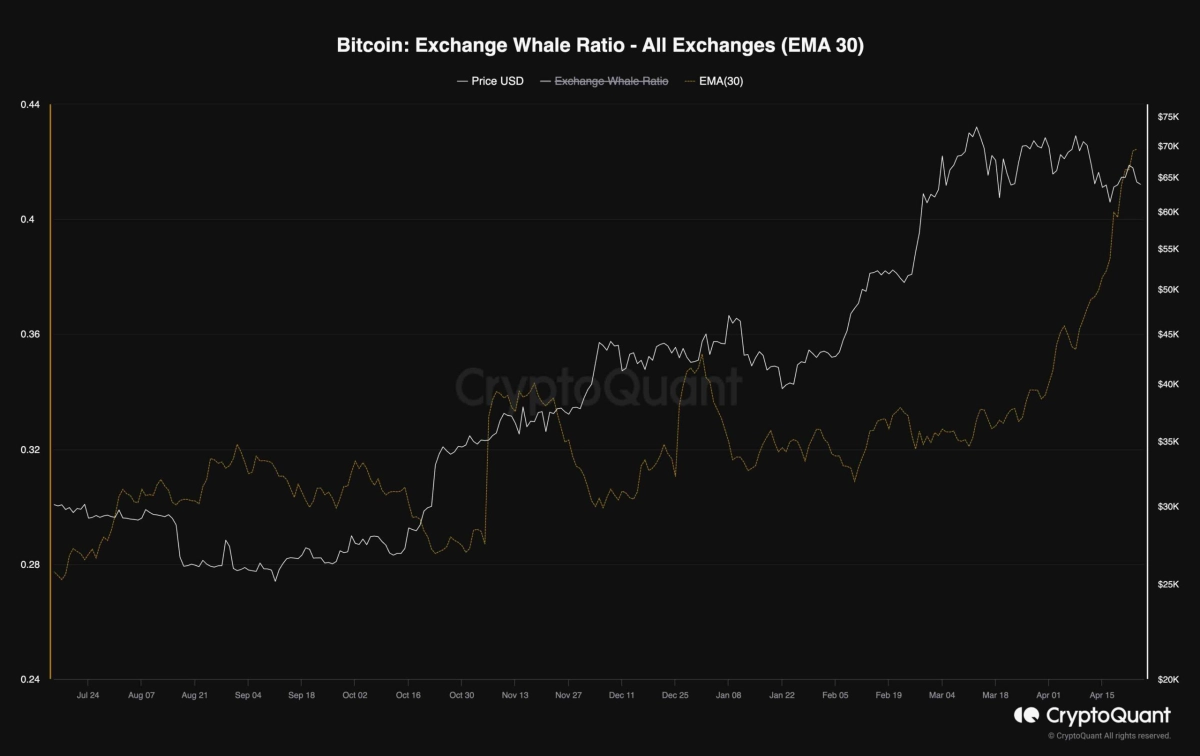
While Bitcoin’s price is consolidating below the $70K resistance level, market participants are wondering who is responsible for the halt in the bull market. This chart demonstrates the 30-day exponential moving average of the exchange whale ratio metric. It is the ratio of the top 10 inflows to the total inflows of the exchange. High values indicate whales are using the exchanges in large amounts.
As the chart depicts, the whale ratio metric has risen significantly over the past few weeks. This can be interpreted as a selling behavior by the whales, as they are depositing large amounts to exchanges. Consequently, this selling pressure might be the culprit for the price’s failure to sustain its rally further.
The post The Reason Behind Bitcoin’s 5% Daily Crash: BTC Price Analysis appeared first on CryptoPotato.
Disclaimer: This article is provided for informational purposes only. It is not offered or intended to be used as legal, tax, investment, financial, or other advice.
Read on CryptoPotato Investment Disclaimer