
Published
1 week ago on
April 26, 2024
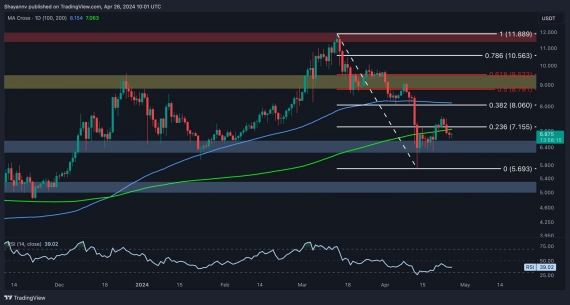
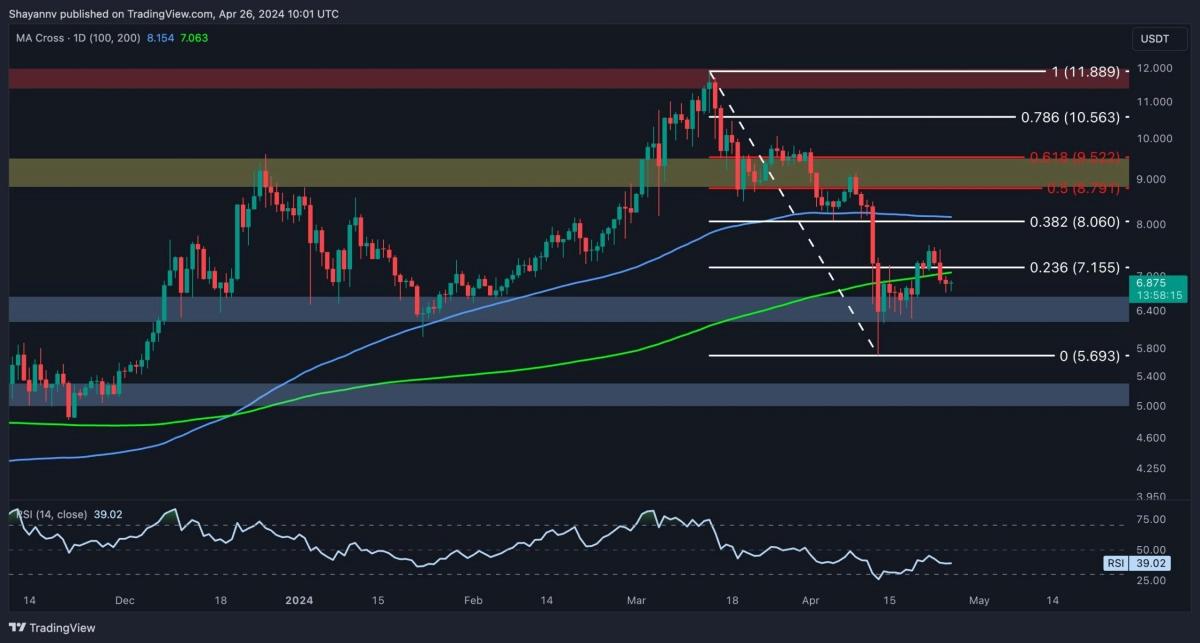
Polkadot has been undergoing a prolonged corrective consolidation around the critical $6.5 support level, with the price retracing slightly toward the 100-day moving average.
However, the short-term expectation is to continue this corrective consolidation phase.
By Shayan
A comprehensive analysis of the daily chart shows a swift rebound near the pivotal support level of $6.5, with the price exhibiting a minor bullish retracement. This suggests a lack of significant market activity and momentum, indicating a cooling down in the futures market.
Nonetheless, the price remains within a crucial price range, bordered by the significant resistance zone of the 100-day moving average at $8.1, aligned with the 0.382 Fibonacci retracement level ($8), and the significant support region of $6.5.
These levels serve as crucial reference points for Polkadot in the short term, and a breakout from this critical range could result in a substantial market movement.
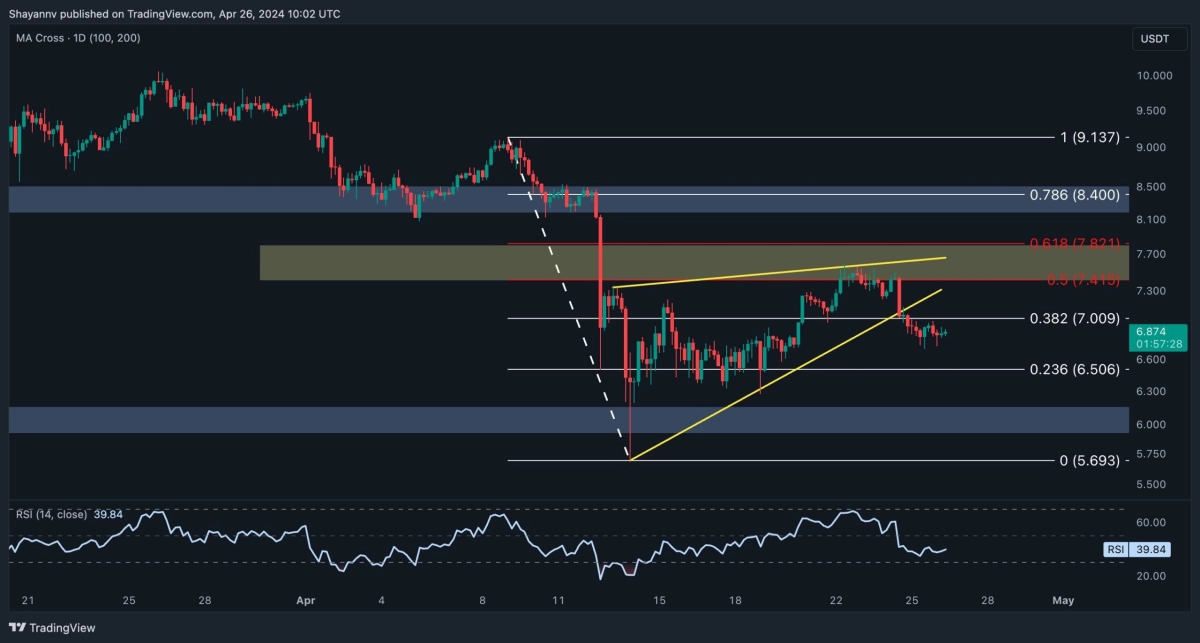
Upon closer examination of the 4-hour timeframe, there is evidence of bullish corrective retracements towards the critical resistance region of the 0.5 ($7.4) and 0.618 ($7.8) Fibonacci levels, leading to the formation of an ascending wedge, a recognized bearish continuation pattern.
However, the Polkadot price has recently faced rejection from the 0.5 Fib level and experienced a decline, breaking below the lower boundary of the pattern.
This suggests the potential for a continued downtrend, with the price aiming for the crucial support region of $6.
By Shayan
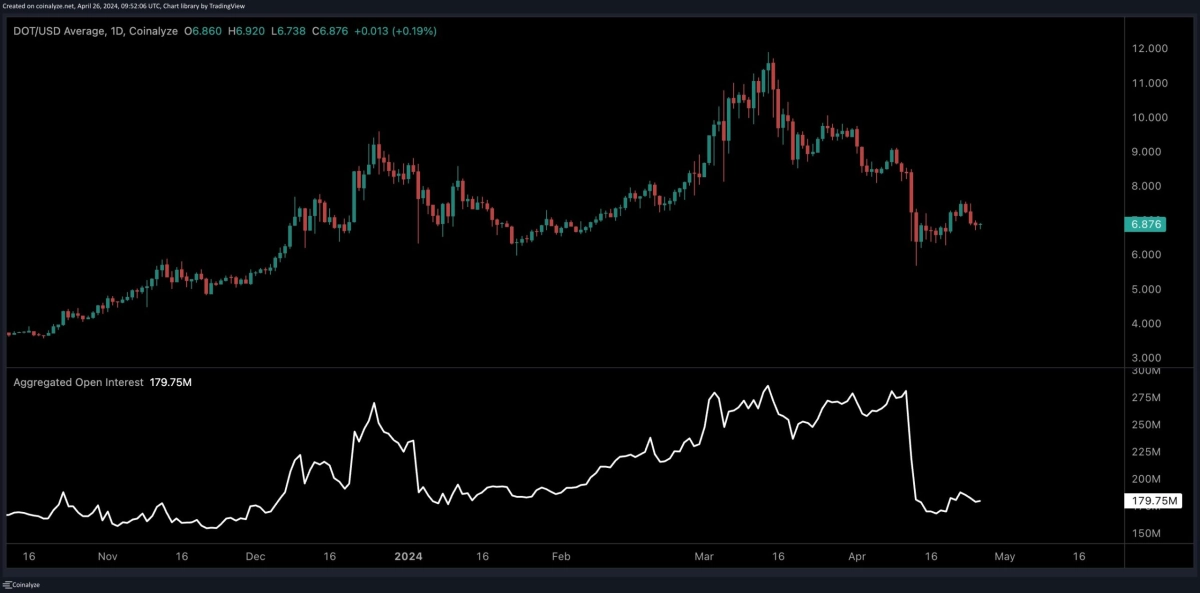
The intensity of long and short positions in the perpetual market, along with the potential for significant liquidations, significantly impacts market volatility.
Open Interest, a crucial metric measuring the number of open perpetual futures contracts across cryptocurrency exchanges, provides valuable insights into market sentiment.
With Polkadot’s recent downtrend, it’s notable that the Open Interest metric has mirrored this trajectory, experiencing a notable decline. This synchronization suggests a reduction in activity within the futures market.
Consequently, as the price is currently testing a critical support region, the market seems primed for the resurgence of long positions, potentially signaling a fresh and decisive market movement.
This post is powered by Polkadot.
The post Is Polkadot Primed for a Major Move Following Extended Consolidation? (DOT Price Analysis) appeared first on CryptoPotato.
Disclaimer: This article is provided for informational purposes only. It is not offered or intended to be used as legal, tax, investment, financial, or other advice.
Read on CryptoPotato Investment Disclaimer