
Published
1 week ago on
April 25, 2024

After a period of consolidation and corrective movements, Ethereum’s price has encountered increased selling activity, leading to a slight decline toward the 100-day moving average.
The main question now revolves around whether Ethereum sellers will manage to break below this crucial moving average.
By Shayan
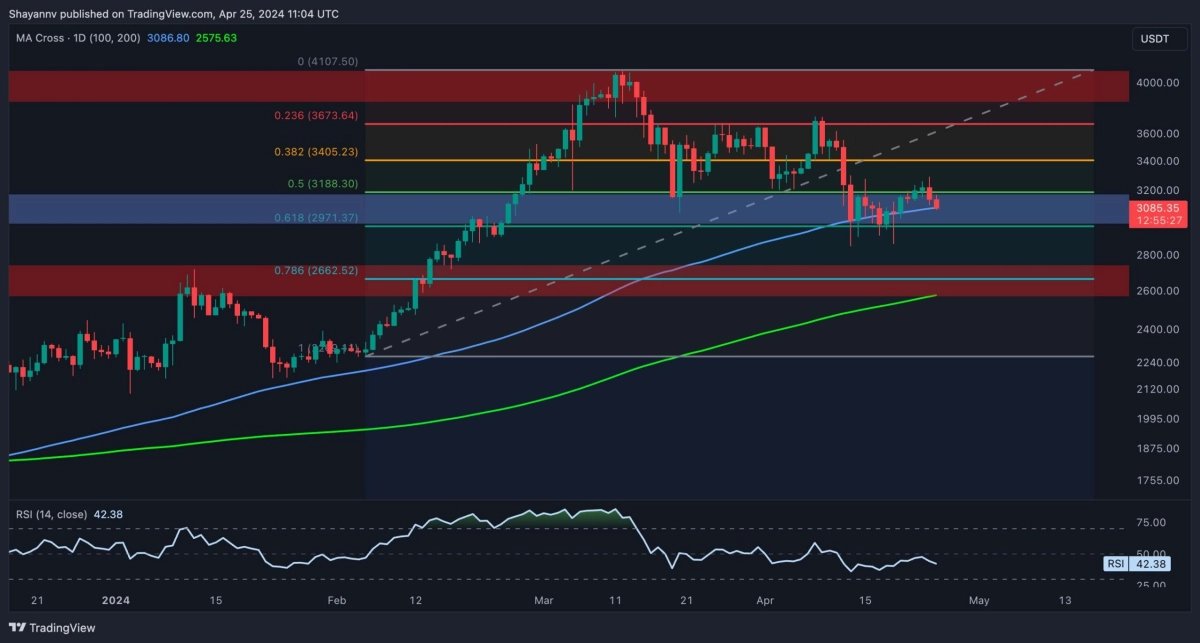
A thorough analysis of the daily chart reveals that following an extended phase of corrective retracements, with the price testing the critical resistance region of $3.2K, the market experienced heightened selling pressure, resulting in a slight downturn.
Consequently, the Ethereum price is now testing a crucial support level marked by the 100-day moving average at $3086. This range holds significance as it typically attracts considerable demand, potentially limiting further downward pressure from sellers.
However, given the current market sentiment and recent price action, Ethereum appears to lack sufficient momentum and buying activity, increasing the likelihood of a new bearish trend in the short term. Nonetheless, an unexpected breach below this critical support zone could trigger a cascade effect towards the 200-day moving average at $2.5K.
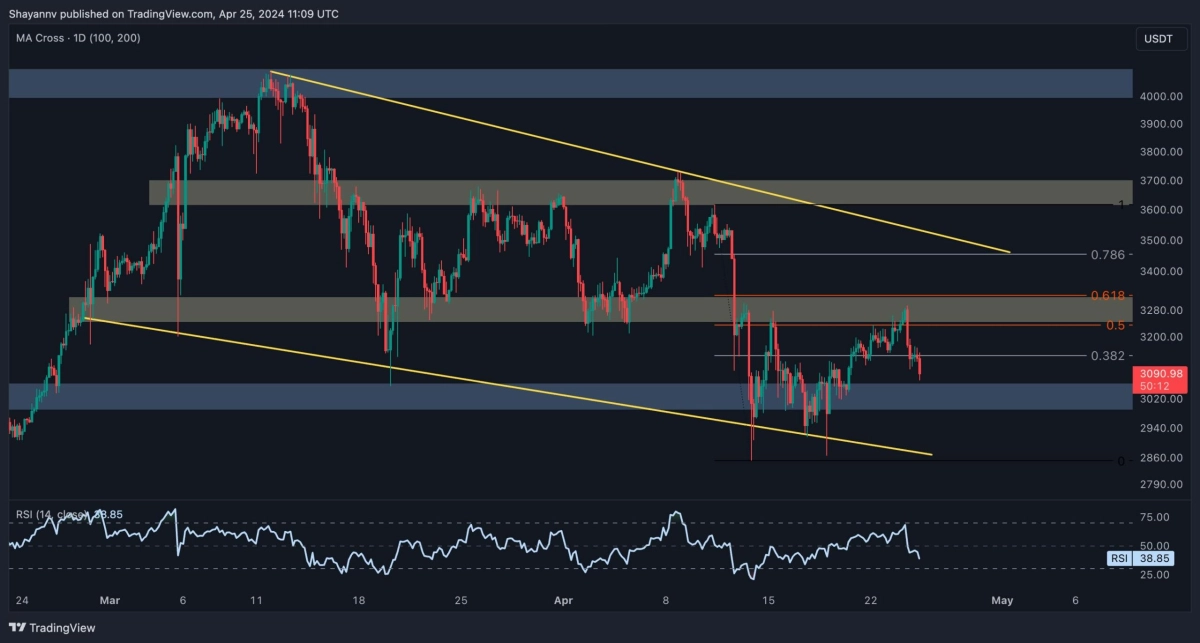
A closer examination of the 4-hour chart reveals that following a period of sideways consolidation near the lower boundary of the wedge pattern, which aligns with the support region around $3K, the price experienced notable buying pressure, leading to a bullish reversal.
This intensified demand resulted in a significant surge towards a critical resistance region, encompassing the 0.5 ($3234) and 0.618 ($3324) Fibonacci levels.
However, sellers regained control and halted the upward momentum, causing a renewed bearish downturn, indicating a notable bearish sign for the market. Nevertheless, despite the prevailing bearish sentiment, Ethereum’s price is expected to remain confined within the crucial range, bounded by support at $2.8 and critical resistance at $3.3, until a breakout occurs.
By Shayan
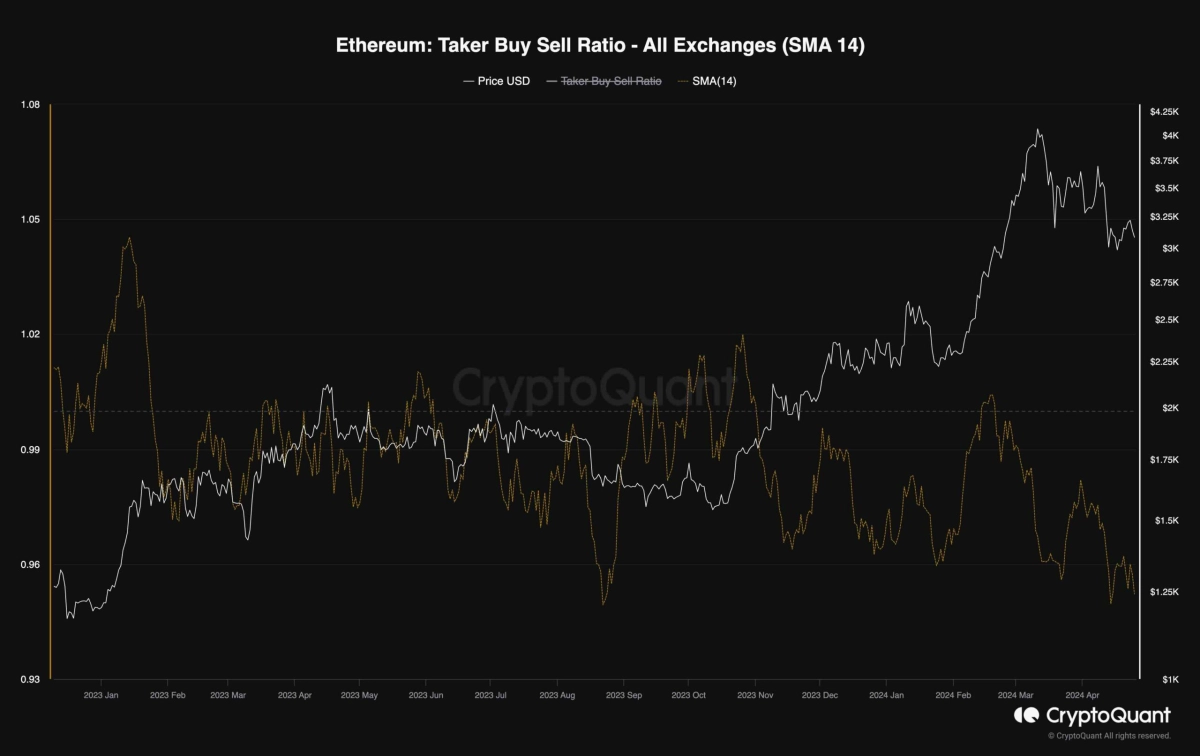
With Ethereum’s price failing to surpass the $3.7K level, investors may be interested in understanding the behavior of futures market traders.
The accompanying chart displays the 14-day moving average of the Taker Buy Sell Ratio, a metric that gauges the aggressiveness of buyers relative to sellers. Values above one signify buyer dominance, while values below one indicate aggressive selling pressure.
As depicted in the chart, not only has the metric failed to recover above one, but it has also been on a sharp decline over the past few weeks. Moreover, the ratio has recently been steadily decreasing, nearing its lowest point since September 2022. This downward trend is concerning and suggests that Ethereum’s bearish trend could last in the mid-term if current conditions persist.
The post Is ETH About to Plunge Below $3K or Will the Bulls Step In? (Ethereum Price Analysis) appeared first on CryptoPotato.
Disclaimer: This article is provided for informational purposes only. It is not offered or intended to be used as legal, tax, investment, financial, or other advice.
Read on CryptoPotato Investment Disclaimer