XRP Could Test $0.80 if the CLARITY Act Dies on January 3, Sam Daodu Warns
 Alex Carter

Three Things to Know
- Analyst Sam Daodu warned that XRP could slide further if the CLARITY Act expires in January.
- Daily momentum sits deep in oversold territory, yet sellers still control the trend.
- Traders are watching one nearby floor that guards the path toward Daodu's lowest target.
Sam Daodu has tied XRP's 2027 recovery hopes to two forces outside Ripple's control. One is Bitcoin. The other is a stalled crypto market structure bill facing a hard congressional deadline.
The timing matters because XRP just hit a fresh yearly low and fund demand has cooled. Traders want to know whether buyers can hold the line before Washington's deadline arrives.
A Senate Deadline Hangs Over a Battered XRP
The market structure bill failed in the Senate 50-49 in September. It dies if Congress does not pass it before January 3, 2027, when Democrats take control of both chambers.
Macro conditions offer little help. The Fed raised its benchmark rate from 3.75% to 4% on September 17. The 10-year Treasury yield then touched 5.1% on November 12, which drains appetite for risk assets.
Bitcoin's earlier rally shows how tightly XRP follows it. BTC climbed from $62,837 on August 16 to $82,131 on October 15. That move carried XRP from $0.99 to $1.52. The gains have since unwound, with Bitcoin near $64,728 and down 28.6% this year.
Spot XRP ETF demand has stalled. Net inflows reached $1.79 billion by November 13. That sits just short of the late October peak of $1.81 billion. The worst day brought a $10.4 million outflow on November 9. Ripple's RLUSD stablecoin, now larger than PayPal's PYUSD, is one bright spot.
Daodu sees XRP topping $1 in 2027 but doubts a return to $1.84. If the bill expires and Bitcoin keeps sliding, he warned, XRP might test $0.90 and even $0.80.
XRP Trades Far Beneath Both Moving Averages After a 27% Monthly Slide
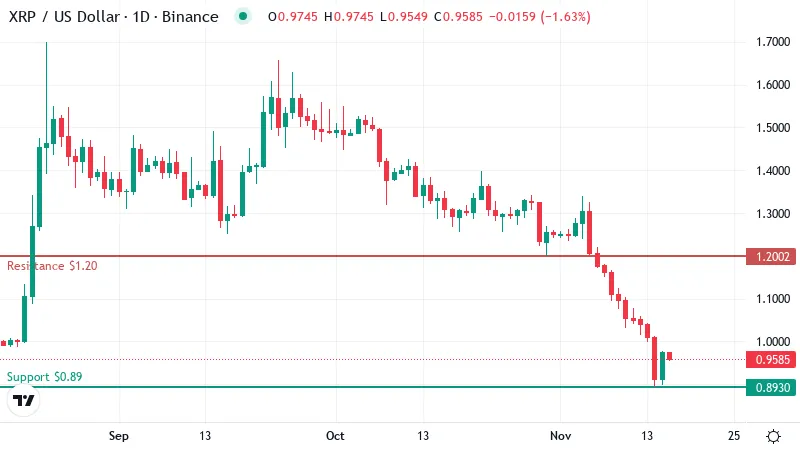
XRP traded near $0.96 at last check, just above the 1-year closing low of $0.91 it set a day earlier. The token has lost about 48% this year. It now sits roughly 74% below its all-time high of $3.65, set in July 2025.
Both key moving averages sit far overhead. The 50-day average is near $1.23. The 200-day sits higher, around $1.33. A moving average smooths out daily noise to show the underlying trend. With price under both, each line acts as a ceiling, and the trend points clearly lower.
The selling has picked up speed. XRP slipped about 2% in the past day and roughly 27% over the past month. The past week did the most damage, with a drop of about 14%. Sellers are pressing harder as the price falls, and buyers have yet to step in.
Supply adds another weight. Circulating XRP rose from about 62.9 billion tokens at the end of September to 63.5 billion now. Ripple releases coins from escrow every month, which puts fresh tokens on the market regardless of demand. Market value has fallen hard over the same stretch, from $142.8 billion on January 5 to about $60.6 billion.
Getting back above the round-number level Daodu flagged would be a modest first step. The bigger test is the 50-day average. Until XRP closes above it, rallies look more like pauses inside a downtrend than a turn.
Sellers Stay in Charge Despite Oversold Readings
The daily RSI, a 0 to 100 gauge of momentum, stands near 26. Readings under 30 count as oversold, meaning the selling has run fast and far in a short time. Stretches like this often lead to a relief bounce as short sellers take profits.
That reading alone does not mark a bottom. Oversold conditions can last for weeks in a strong downtrend, and prices can keep sliding while the gauge stays low.
Other signals still favor the bears. The MACD sits below its signal line, so momentum keeps pointing down. Trend strength readings also show a real trend, and sellers are the ones driving it.
The Last Floor Before the $0.80 Warning
On the daily chart, support sits near $0.89. That level lies just under the recent 1-year closing low, so buyers have defended this area only once so far. The data maps no further support below it.
A daily close under that level would leave open air beneath the price. That would put the downside targets Daodu warned about squarely in play.
Overhead, the first resistance stands near $1.20. It sits just below the 50-day average, which makes that zone a double ceiling. The next barrier lines up with the 200-day average.
Daodu set a clear bar for a turn. He wants a daily close above $1.26, backed by spot ETF inflows that beat their late October peak. Fresh fund demand would need to confirm the price move.
Where the Next 72 Hours Could Take XRP
With RSI deep in oversold territory, XRP's next move depends on which side of its nearest support wins over the coming days.
- Bullish: Buyers defend the support line and push XRP back above the round-dollar mark. A relief bounce could then carry it toward first resistance just under the 50-day average. A break below support would cancel this setup.
- Bearish: A close under support leaves no mapped floor and opens the way to Daodu's lower target. A recovery above first resistance would invalidate this view.
Oversold but Not Yet Saved
XRP looks stretched enough for a short-term bounce, and oversold readings often invite one. The trend stays bearish until price reclaims its moving averages, starting with the 50-day line.
The risks sit outside the chart. If the bill lapses in January or Bitcoin keeps sliding, sellers could break support quickly.
Disclaimer: This article is provided for informational purposes only. It is not offered or intended to be used as legal, tax, investment, financial, or other advice.
Disclaimer: This article is provided for informational purposes only. It is not offered or intended to be used as legal, tax, investment, financial, or other advice.
Related Stories