Why SOL Dropped 18% This Week: Fed Hike Fears and $4B in Long Liquidations
 Alex Carter

Three Things to Know
- A hot US inflation report revived Fed hike fears and triggered a wave of forced selling across crypto.
- Solana's momentum gauge has dropped to its most oversold reading since early June, when a long rally followed.
- A cluster of resistance in the high $90s separates a short relief bounce from a real recovery.
Solana suffered one of the steepest drops among major tokens this week. Rising bets on a larger Fed rate hike and a cascade of leveraged long liquidations dragged the token to levels last seen in early summer.
Activity on Solana's own network has also cooled for weeks. Traders now face one question: can extreme oversold conditions spark a lasting rebound, or will sellers break the June floor first?
A Hot Inflation Print Sends SOL to Its Lowest Since June
A hotter-than-expected US inflation report jolted crypto markets this week. The data raised the odds that the Federal Reserve will act more aggressively. Traders tracking the CME FedWatch tool now see a hike of up to 50 basis points in January as the baseline.
Solana took one of the hardest hits. SOL fell about 18% in a week and touched $70 for the first time since June.
The selling fed on itself. Long liquidations across crypto neared $4 billion over five days as support levels gave way, forcing leveraged buyers out of their positions. The Crypto Fear and Greed Index dropped to 12, deep in Extreme Fear. That marks its lowest reading since February.
Solana also carried its own weakness into the sell-off. Weekly DEX volume has fallen for seven straight weeks, according to DeFi Llama. It slid about 48% from a mid-September peak to $9.2 billion. The Alpenglow upgrade has so far done little to revive on-chain activity.
Trading volume now runs at about 7% of SOL's circulating market cap. That level points to heavy, active selling.
SOL Trades Far Beneath Both Key Averages After a 32% Monthly Slide
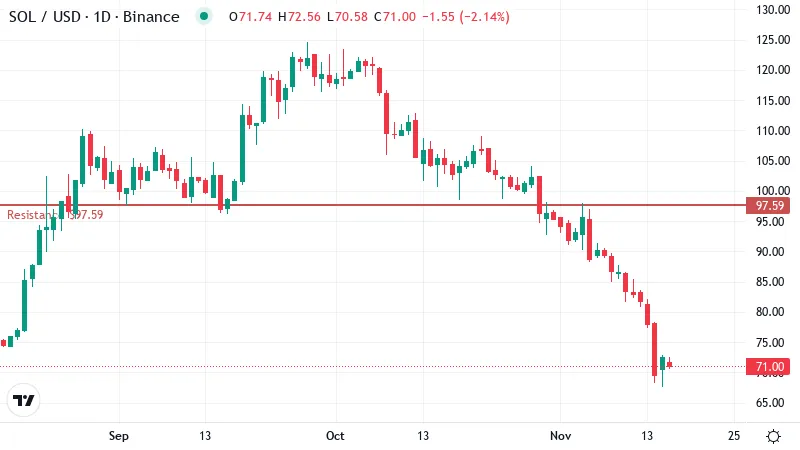
SOL changed hands near $71 on Friday, down about 2% over the past day. Over the past 30 days, the token has lost roughly 32% of its value.
That monthly drop came in steps. Sellers pressed the price lower week after week, and each attempt to stabilize gave way. The pattern points to steady distribution over time.
Moving averages help show where the trend stands. A moving average smooths out daily swings by tracking the average closing price over a set number of days. SOL now trades below both its 50-day and 200-day averages, which sit near $94 and $96.
That tight cluster forms a ceiling above the current price. Any rally that reaches it would likely meet sellers who bought higher and want to exit near breakeven.
The gap matters for anyone hoping for a quick turnaround. Reclaiming those averages would require a gain of about one-third from current levels. Repairing the broader trend would take weeks of steady buying.
Oversold Readings Hint at a Bounce Sellers Still Control
RSI, a 0 to 100 gauge of momentum, now reads about 21 on the daily chart. Anything below 30 counts as oversold, which means sellers have pushed the price down faster than usual. Over the weekend the reading sank to 14, its lowest since early June.
That June low offers a useful precedent. SOL bottomed then and climbed from about $60 to around $120 over roughly three months. Readings this extreme often mark the point where selling runs out of fuel, at least for a while.
The rest of the picture still favors sellers. MACD, a tool that compares short and longer price trends, remains below its signal line, so momentum is still pointing down. Trend strength readings also show a real downtrend, led by sellers.
Oversold conditions can last longer than traders expect. A bounce would look more convincing once buyers hold gains for several sessions.
The Wall Between a Bounce and a Recovery
A relief bounce has a clear first test. Analysts eye a first target just under the moving averages, where supply should show up. Holders who bought in recent weeks may use any rally to get out.
Resistance near $98 is the real wall. It sits just above both averages, so price would need to clear all three hurdles in one move. A close above it would turn that ceiling into a possible floor. The next ceiling waits near $104, where sellers could step in again.
The downside looks less tidy. SOL could slip back toward its June base before any bounce takes hold. That would test buyers' resolve near a level that held once before.
A break below that zone would leave few obvious floors. The nearest chart support sits far lower, around $42, with nothing listed beneath it.
What the Next Three Days Could Bring
SOL's path likely depends on whether oversold conditions spark buying or the June low gives way.
- Bullish: An oversold bounce carries SOL back to the near-term target under the moving averages. A slip into the June base would invalidate this view. A real follow-through would still need a close above the resistance wall in the high $90s.
- Bearish: A break below the June low opens the path toward distant support in the low $40s. A recovery to the moving averages would invalidate this view.
Bounce Likely, Trend Still Broken
Deeply oversold readings give SOL decent odds of a short rebound. That bounce would still sit inside a seller-led downtrend.
The main risk comes from outside the chart. A more hawkish signal from the Fed, or another wave of forced long selling, could push SOL lower despite the oversold signals.
Disclaimer: This article is provided for informational purposes only. It is not offered or intended to be used as legal, tax, investment, financial, or other advice.
Disclaimer: This article is provided for informational purposes only. It is not offered or intended to be used as legal, tax, investment, financial, or other advice.
Related Stories