What It Would Take for XMR to Lose $600 and Slide Back Toward $160
 Alex Carter

Three Things to Know
- Hackers who allegedly hit a major French bank routed stolen funds into Monero, raising questions about the coin's monthly rally.
- XMR trades well above its key moving averages, with momentum readings still favoring buyers.
- The late-October floor near $600 is the line that separates a steady uptrend from a much deeper slide.
An alleged cyberattack on French lender Credit Mutuel Arkea sent tens of millions in stolen funds through Ether and into Monero. The bank confirmed the breach and said customer money is safe.
The timing puts XMR under a spotlight while it outpaces a weak market. Traders now want to know whether the rally rests on real demand or on illicit flows, and how far thin liquidity could drag the price if support cracks.
Stolen Bank Millions Flow Into Monero, Yet the Rally Came First
On-chain investigator ZachXBT named French lender Credit Mutuel Arkea as the target of a cyberattack that allegedly netted more than $133 million. The bank, which holds about $235 billion in assets, confirmed the attack. It did not disclose the amount and said customer funds are safe.
ZachXBT traced $108.8 million in USDC withdrawn from Kraken, Crypto.com and OKX within 21 hours. The attackers swapped the stablecoins into ETH, then moved the funds into Monero.
The flow looks large on paper. At most, it equals about 55% of XMR's $198 million daily volume. Against a $12 billion market cap, it amounts to roughly 0.9%.
Timing also weakens the link. XMR traded near $562 on Oct 5. It had reached about $621 by Oct 21, before any disclosure. Only about 6.7% of the rise lines up with the stolen-fund moves. Delistings from regulated exchanges have thinned liquidity, so even modest flows can move the price.
Disclosure day told the same story. XMR rose 2.6% that day and lagged the majors. BTC gained 3.7%, while ETH and ZEC rose 6.0% and 9.5%.
Monero Outruns a Falling Market From Well Above Its Averages
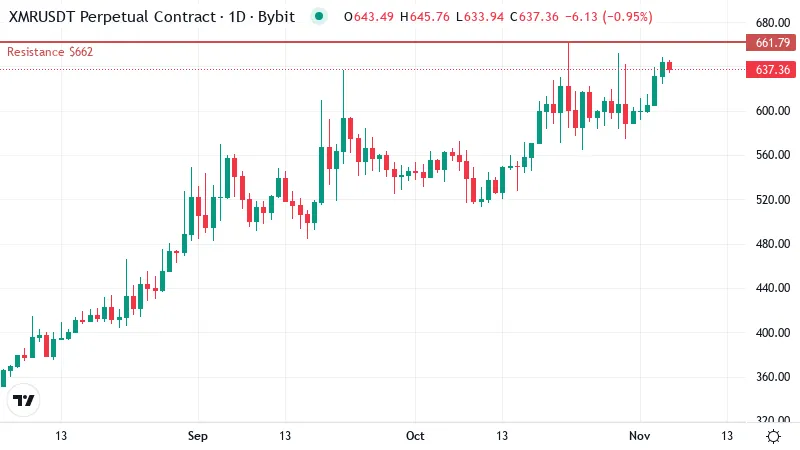
Monero changed hands near $637 on Thursday, flat on the day but up about 6% over the past week. Over a month the coin gained roughly 13%. That steady climb has carried it well clear of its longer-term trend lines.
The 50-day moving average, which tracks the average closing price of the last 50 sessions, sits near $569. The 200-day average rests around $464. Price above both lines means each one now acts as a floor, and the gap between them points to a clear uptrend.
Bitcoin moved the other way. It fell about 6.1% over the same 30 days, and Ether dropped roughly 10.2%. Zcash, Monero's closest privacy rival, slipped slightly.
That contrast matters for the hack question. A coin that rises while the majors bleed is drawing its own buyers. Privacy demand and thin exchange supply explain that gap better than one batch of stolen funds.
The rally has not been a straight line. XMR pulled back to about $599 on Oct 31 before buyers stepped in again. That dip stopped right at the $600 area, which turned it into the first level bulls need to defend.
A return to that zone would test whether those dip buyers are still there.
Buyers Still Hold the Momentum Edge
Momentum readings back the buyers for now. The daily RSI, a 0 to 100 gauge of how fast and how hard price is moving, sits near 63. That counts as strong. It also leaves room before the 70 mark, where rallies often run out of fuel. In plain terms, the climb still has space to extend before it looks stretched.
The MACD, a tool that compares short and longer price averages, has crossed above its signal line. That shift means upward momentum is building again after the recent dip. Trend-strength readings agree, showing a real trend with buyers in control.
Thursday's stall fits a market catching its breath. Price held the week's gains, and sellers have not shown up in force.
Below $600 the Map Turns Empty Down to $169
Overhead, the first ceiling sits near $662. Sellers would likely show up there first, since that zone caps the current leg. A daily close above it would open a run at about $740, the next mapped barrier. That level sits within reach of the January record near $798.
The downside looks very different. A drop through the $600 area would put the 50-day line in play as the next cushion. If that average gave way too, the chart shows no mapped support until roughly $169. Below that, the next floor rests near $145.
Few price levels in between have drawn strong buying, so a breakdown could travel fast once it starts. Thin exchange liquidity would make the slide steeper.
Such a move would need sellers to hold price below the 50-day average for days. Nothing in the current readings shows that yet.
Two Roads From $637 Over the Next Three Days
Each path has a level that would cancel it.
- Bullish: A daily close above $662 would confirm that buyers broke the current ceiling. That opens the next barrier. The idea fails if price closes back under $600, which would show the breakout lacked support.
- Bearish: A close below $600, followed by a break of the 50-day average, would leave little in the way of a deep slide. A reclaim of the ceiling would cancel that view.
Trend Intact While $600 Holds
Monero's climb rests on its own demand, and buyers still control the trend. That holds as long as price stays above the October floor.
The risk sits in the plumbing. Delistings have left fewer venues and thinner order books. A clean break of that floor could turn into a far sharper drop than usual.
Disclaimer: This article is provided for informational purposes only. It is not offered or intended to be used as legal, tax, investment, financial, or other advice.
Disclaimer: This article is provided for informational purposes only. It is not offered or intended to be used as legal, tax, investment, financial, or other advice.
Related Stories