Technical Analyst Warns XRP Could Revisit $0.60 Before Any Run Toward $60
 Alex Carter

Three Things to Know
- A chartist warns XRP may slide toward $0.60 before any long-range run higher.
- The two-week Gaussian Channel has turned red, and daily momentum still favors sellers.
- The nearest daily floor sits just above his revisit zone.
A technical chartist has flagged a red signal on XRP's two-week Gaussian Channel. He expects a deeper pullback first, yet he still sees very large gains later.
The warning lands after a steep monthly slide that has left XRP deeply oversold. Traders now want to know whether a bounce can hold the current floor or whether price drops to his reset zone first.
A Red Gaussian Channel Meets a $180 Dream
The Gaussian Channel smooths price into a band and colors it by trend direction. The chartist's name was not disclosed.
He reads the red flip as a warning that XRP could slide back toward about $0.60, resetting the market before any larger move. Once the cycle turns higher, he expects $60 and later $180. He gave no firm time frame.
Those goals sit far from the market. XRP trades near $0.98, so the first target implies a gain of roughly 6,000%.
His bullish view has clear failure points. A two-week close below his reset zone would break the cycle low he expects to hold. A long stall under the long-term moving averages would also weaken it.
XRP Trades a Quarter Below Where It Started the Month
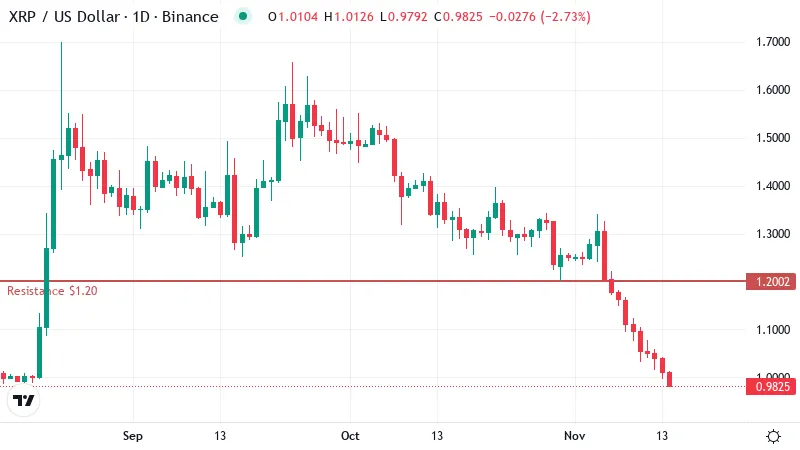
XRP has lost about 26% over the past 30 days, and the selling has sped up lately.
Most of the drop came in the last week. XRP fell about 17% over seven days, and it shed another 3% in the past 24 hours.
Moving averages confirm the weakness. A moving average tracks the average closing price over a set number of days and shows the broader trend. XRP now trades below its 50-day average near $1.25. It also sits under its 200-day average, around $1.34.
With price under the shorter average and that average under the longer one, the setup is bearish. Both lines now act as ceilings.
The 50-day line is the first trend marker overhead. A move back above it would be the earliest sign that the short-term slide has ended.
Sellers Are Exhausted but Not Yet Done
RSI, a 0 to 100 gauge of momentum, sits near 19 on the daily chart. Any reading under 30 counts as oversold. This one is deep in that zone, which means sellers have pushed price down faster than usual.
Readings this stretched often come before relief bounces. Still, an oversold reading alone is no buy signal. Tokens can stay oversold for weeks in a strong downtrend.
Other gauges show the pressure has not eased. The MACD, a tool that compares short and longer price averages, remains below its signal line. That means momentum is still pointing down. Trend-strength readings show a real trend, and sellers lead it.
The Last Floor Before the Chartist's Target
On the daily chart, the nearest support sits near $0.63. That level lies just above the chartist's revisit zone. That overlap gives his warning some weight.
Below that floor, the data maps no further support.
Overhead, the first ceiling sits near $1.20. A daily close above it would be the earliest hint that selling pressure is fading. The next barrier waits near $1.31.
That second level sits just under the 200-day line, so reclaiming both would restore the long-term trend.
Which Way Does XRP Break From Oversold?
- Bullish: A relief bounce that closes above the first ceiling would open a run toward the next barrier, just under the 200-day line. A slip back below today's trading price would cancel that setup.
- Bearish: Losing the current price area would put the daily floor near the chartist's revisit zone in play. A daily close above the first ceiling would undo the bearish case.
The Near Term Belongs to the Bears
For now, the chart backs the chartist's warning more than his long-range targets. Price sits under both long-term averages, and sellers still lead.
Deeply oversold markets can snap back hard, though. A break of the daily floor would leave XRP with no clear support beneath it.
Disclaimer: This article is provided for informational purposes only. It is not offered or intended to be used as legal, tax, investment, financial, or other advice.
Disclaimer: This article is provided for informational purposes only. It is not offered or intended to be used as legal, tax, investment, financial, or other advice.
Related Stories