SUI Sellers Are Back in Control as NEAR Drops 16%. Here's What Swing Traders Can Do Next
 Alex Carter

Three Things to Know
- NEAR holders approved a second inflation cut in about a year, though the change will take months to arrive.
- Both NEAR and SUI show weak momentum, with sellers still leading the trend on the daily charts.
- SUI sits just above nearby support, while NEAR must reclaim its 50-day line to repair the chart.
NEAR token holders voted to slow the growth of new supply, approving a lower inflation cap through the network's governance system. The vote passed while NEAR was in a sharp weekly slide.
The cut is a long-term story, and traders work on a shorter clock. Sellers still lead both NEAR and SUI, and SUI has lost its long-term trend support. Buyers now need to defend nearby floors before another leg lower tests them.
NEAR Holders Vote to Shrink New Supply to 1.6%
NEAR token holders approved a smaller ceiling on new supply. Proposal HSP-029 passed through the House of Stake governance system and was finalized on Nov 2, 2026. It lowers maximum annual inflation from 2.5% to 1.6%. The network made a similar move in October 2025, so this is its second cut in about a year.
The change will not arrive quickly. It phases in over roughly two years and still needs a Security Council review, a 90-day grace period and a validator protocol upgrade.
Once in place, the cap should mean about 11.8 million fewer new tokens a year, worth roughly $45 million at recent prices. That puts NEAR below Solana's 3.82% inflation rate. History offers a warning, though. Earlier cuts did not lift the price, and smaller staking rewards could lead some stakers to sell.
Demand may matter more than supply. NEAR Intents, the network's cross-chain trading service, posted a record $2.4 million in October revenue on $3.9 billion of 30-day volume.
NEAR Bounces but Still Trades Under Its 50-Day Line
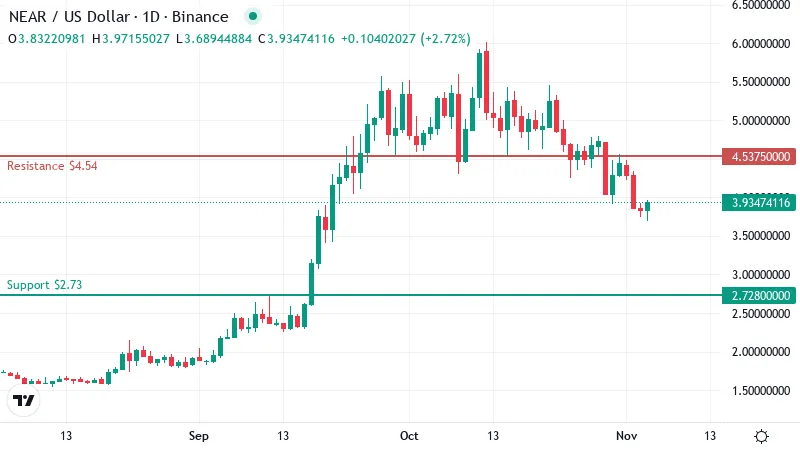
NEAR traded near $3.93 on Tuesday, up about 3% on the day. The bounce is small next to the damage. The token lost roughly 16% over the past week and about 20% over the past month. The governance vote has not changed the direction of the chart yet.
The 50-day moving average, which tracks the average closing price over that period, sits near $4.27. NEAR trades below it, so that line now acts as a ceiling. Buyers will need to push through it before the recent slide looks finished.
Over a longer horizon, the chart holds up better. The 200-day average sits far lower, near $2.96, and price remains well above it. That keeps intact the broad recovery that began at February's yearly low. Recent selling has cut into those gains without erasing them.
Momentum still favors sellers. RSI, a 0 to 100 gauge of momentum, reads 41. That is weak territory, below neutral and above oversold. The MACD sits under its signal line, so momentum is still pointing down. Trend-strength readings show a real trend, and sellers lead it.
On the daily chart, the first hurdle is resistance near $4.54. A close above that level would be the first real sign of repair. It would also put NEAR back over the 50-day line. Above it, the next ceiling stands near $5.52.
The downside carries more risk. Nearest support is far below, around $2.73. If the bounce fails, the chart shows little in between to slow a drop. A break there would expose the next floor near $2.21.
Why SUI Has Less Cushion Than NEAR
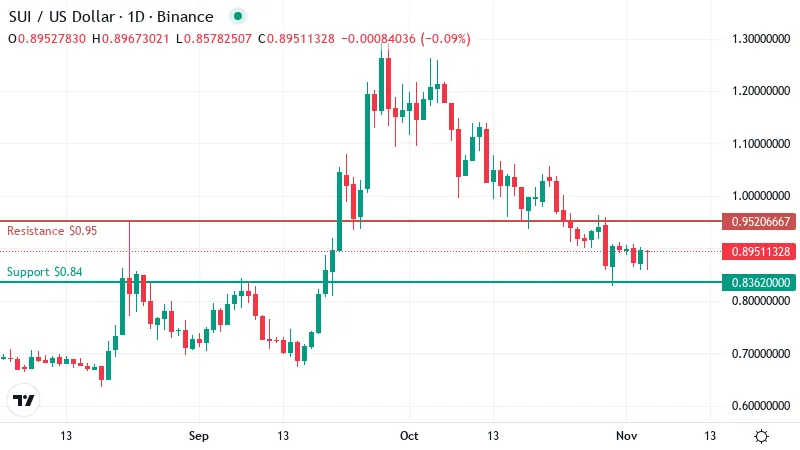
SUI traded near $0.90 on Tuesday, flat on the day. The weekly loss was milder than NEAR's, at about 4%. The monthly picture looks worse, with the token down roughly 26% over 30 days.
The bigger problem is structure. SUI sits below both its 50-day and 200-day averages. The longer line sits near $0.97. NEAR still holds its long-term line, which gives it a floor far below the current price. SUI has no such backstop, so both averages now act as ceilings.
Momentum offers no relief. RSI reads the same weak 41 as NEAR, and MACD also points down. Sellers lead this trend too.
On the daily chart, the 50-day line doubles as first resistance near $0.95. A close above it would also bring the 200-day average into reach just overhead. Clearing both would open a path toward the next ceiling near $1.06.
Support sits close, around $0.84. That leaves little room for error, since a modest dip would test it. A break would expose the next floor near $0.71, a much deeper drop.
Two Paths for the Next 72 Hours
Both coins sit closer to a decision than their quiet daily moves suggest. These setups use the levels marked on the daily charts.
- Bullish: NEAR posts a daily close above its first resistance and aims for the higher ceiling, while SUI clears its 50-day line and heads toward its next ceiling. A slip back under Tuesday's prices would cancel this setup for both coins.
- Bearish: SUI loses its nearby support and slides toward the deeper floor, while NEAR stalls under the 50-day line and drifts toward its first support. Closes back above first resistance on both charts would invalidate this view.
Supply Cuts Need Time While Sellers Need Only One Break
The inflation vote helps NEAR over the long run, since slower supply growth favors holders who stay for years. Swing traders face a shorter clock. Waiting for each coin to reclaim its first resistance on a daily close looks safer than buying now.
Near-term risks still dominate. Implementation sits months away, and stakers facing smaller rewards could sell before any benefit arrives.
Disclaimer: This article is provided for informational purposes only. It is not offered or intended to be used as legal, tax, investment, financial, or other advice.
Disclaimer: This article is provided for informational purposes only. It is not offered or intended to be used as legal, tax, investment, financial, or other advice.
Related Stories