Stacks Co-Founder Says the Bitcoin Low Is Likely Set Even After a 12% Drop in Seven Days
 Alex Carter

Quick Take
- Stacks co-founder Muneeb Ali says the Bitcoin bottom is likely in and calls the slide an early bull-market pullback.
- Bitcoin sits deep in oversold territory, yet sellers still control the trend.
- The nearest floor near $63K now decides whether his call survives.
Muneeb Ali, who co-founded the Bitcoin layer-2 network Stacks, said he believes Bitcoin has likely found its low. He sees the recent selloff as a shakeout early in a larger bull cycle.
His call lands after one of the sharpest weekly drops this year. Traders want to know whether oversold conditions spark a rebound or a lower low comes first.
Muneeb Ali Calls the Bottom While Bitcoin Keeps Sliding
Ali told followers the Bitcoin bottom is "likely in." Stacks adds smart contracts and apps on top of Bitcoin. Ali has built on the asset for years, so his view carries weight with many longtime holders.
Ali frames the recent slide as an early pullback inside a bull market. In his reading, the cycle is still young, and sharp drops like this one tend to shake out leveraged traders before the uptrend resumes. He did not attach a price target or a time frame to the call.
The market has not made his case easy. Bitcoin trades near $67K after losing about 12% over the past week, and sellers have pressed lower almost daily.
With no target to measure, the test of his call is simple. The low has to hold.
Bitcoin Trades Well Under Both Long Averages
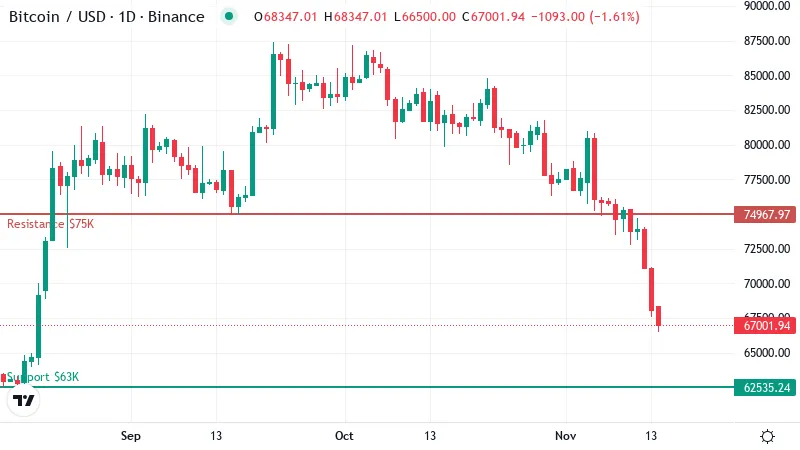
Bitcoin now sits below both of its long-term moving averages. A moving average smooths out daily swings to show the underlying trend. The 50-day average stands near $78K. The 200-day average sits just below it, around $76K.
When price trades under these lines, they tend to cap rallies. For now, the trend argues against a confirmed bottom.
The 50-day still sits above the 200-day, which means the breakdown is recent.
That setup cuts both ways. A quick recovery would fit Ali's view of a pullback inside a larger uptrend. A continued slide would drag the 50-day under the 200-day, a sign that a longer downtrend has taken hold.
Bitcoin has shed about 18% over the past month and trades near the bottom of its 30-day range.
It slipped about 2% in the past 24 hours, so buyers have yet to step in with force.
Oversold Readings Have Not Yet Turned Into a Bounce
RSI, a 0 to 100 gauge of momentum, has dropped to about 23 on the daily chart. Readings under 30 count as oversold. Bitcoin has fallen fast enough that sellers may be running short of fuel.
Stretches this deep often come before relief rallies, which gives Ali's case some support.
Other momentum signals have not turned yet. The MACD, which tracks shifts in momentum, still points down.
Trend gauges show a real downtrend led by sellers. An oversold reading can stay pinned for days in that kind of market. A bottom needs buyers to show up, and so far they have not.
$63K Is the Floor Ali's Call Depends On
Support near $63K carries most of the weight in Ali's argument. A daily close below it would mean the low was not in. That break would open the way toward the next support near $59K.
Dip buyers would then be underwater, and some would likely sell into further weakness.
Resistance stands near $75K, close to the 200-day average, which makes it a double barrier. A move back through it would be the first solid evidence for the pullback view.
The next hurdle waits near $80K, just above the 50-day line. Clearing that zone would put the recent breakdown behind Bitcoin.
What Would Prove Him Right or Wrong
- Bullish: Buyers defend support, and the oversold reading turns into a relief bounce. A push back toward resistance at the 200-day line would support Ali's view. A daily close under that floor would cancel this scenario.
- Bearish: Sellers break the nearest floor and drag Bitcoin toward the lower support. That would suggest the low is still ahead. A reclaim of the first ceiling would undo this case.
A Bold Call That the Chart Has Yet to Back
Ali's call has a fair basis, since deep oversold readings often mark the late stage of a selloff.
The chart has not confirmed it yet. Sellers still lead the trend, and markets like this can stay oversold and keep falling for longer than buyers expect.
Disclaimer: This article is provided for informational purposes only. It is not offered or intended to be used as legal, tax, investment, financial, or other advice.
Disclaimer: This article is provided for informational purposes only. It is not offered or intended to be used as legal, tax, investment, financial, or other advice.
Related Stories