Solana Price Outlook for November: One Level Remains Critical Above $70
 Alex Carter

Three Things to Know
- Solana Labs spun up Leap, a beta mobile app for trading tokenized stocks, metals and crypto around the clock.
- SOL trades under both of its major moving averages, and momentum still favors sellers despite an oversold reading.
- The lower support shelf just above $70 is the line bulls cannot afford to lose this month.
Solana Labs launched Leap this week, and the company plans to use future fees to buy and burn SOL.
The token did not celebrate. SOL slid on launch day and remains deep in a monthlong downtrend.
Solana Labs Bets on Round-the-Clock Tokenized Trading With Leap
Leap wants to bring traditional assets to phones. Its beta mobile app lets users trade tokenized stocks, ETFs, metals, currencies and crypto at any hour, subject to restrictions. Early access runs on iPhone through Apple's TestFlight. Android support is coming soon, and the app is not available in the U.K. or other restricted regions.
The Dialect team built the product. Solana Labs acquired Dialect earlier this year, and the team previously created Solana Actions, Blinks and X cashtags.
Leap charges no fees at launch, though network and routing costs still apply. Future fees will also fund referrals. Founders Club members will earn 30% of fees from people they invite and 5% from those users' referrals.
Trades route through Jupiter, with Helius running infrastructure and Birdeye supplying data. Chris Osborn, Leap's general manager, said Solana confirms a trade in about 150 milliseconds thanks to its Alpenglow upgrade. Co-founder Anatoly Yakovenko said every app that brings new people onchain strengthens the ecosystem.
The launch adds to a broader tokenization push on the network. Samsung Wallet recently added USDC on Solana, and Securitize brought tokenized Nvidia, Apple and Amazon shares to the chain. Traders were not impressed on the day, though. SOL fell 7.34% on Nov 5.
Sellers Keep Solana Pinned Under Both Key Averages
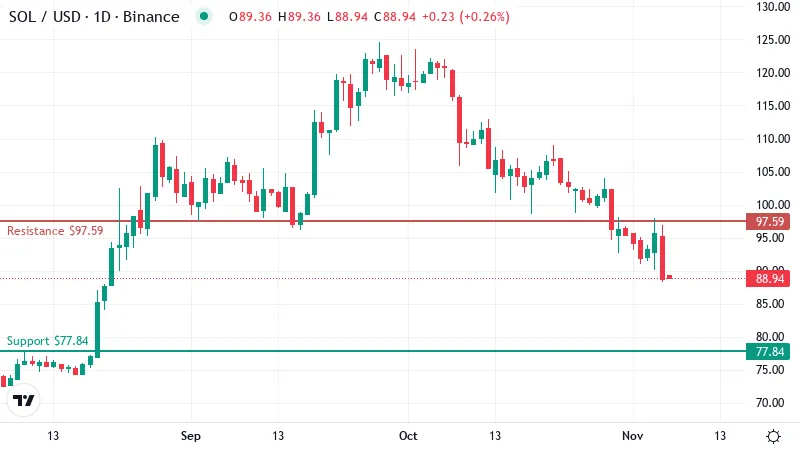
SOL traded near $89 at last check, roughly where it stood a day earlier. That calm comes after a rough stretch. The token is down about 7% over the past week and about 26% over the past month.
The monthly loss shows the selling started weeks before Leap went live. The launch arrived into a market that was already weak, and it did little to change the mood.
Moving averages tell the same story. A moving average smooths out daily swings by tracking the average closing price over a set period. SOL sits below its 50-day average near $102. It also trades under its 200-day average. Both lines now act as ceilings overhead.
When price trades under both averages, analysts read it as a downtrend. A short dip usually holds above the longer 200-day line. SOL has given up that line too, which means sellers have controlled the market for some time.
The 50-day average also sits above the 200-day. That gap shows how fast the recent slide has been. The shorter average has not yet caught up with the drop in price.
Sellers paused for a day, but buyers did not push back with any force. SOL would first need to climb back above those averages before traders could call the downtrend over.
Oversold Readings Have Not Yet Stopped the Slide
RSI, a 0 to 100 gauge of momentum, has dropped to about 29 on the daily chart. Readings below 30 count as oversold. That means sellers have pushed price down faster than usual, and markets in this state often bounce as short sellers take profits.
An oversold reading warns sellers, yet it gives no buy signal by itself. Coins can stay oversold for days or weeks when a downtrend has real strength behind it.
SOL fits that pattern for now. Momentum still points down, and trend gauges show sellers leading a firm trend.
Any relief rally therefore needs proof. Traders would want to see momentum turn higher and price hold its gains before trusting a bounce.
The Floor Bulls Must Defend
Nearest support sits near $78, the first level buyers need to hold on the daily chart. That shelf lies more than 10% below the current price, so SOL has some room before it gets tested. A clean break would show that sellers still have fresh supply to unload.
Below that, the next support waits around $72. It is the last shelf above $70. Losing it would leave SOL without a clear floor in the data and could invite a deeper slide.
Overhead, the first resistance sits just under the 200-day average, and the two form one thick ceiling. Sellers who bought higher may use any rally into that zone to exit.
Clearing it would bring the next ceiling around $104 into view. That level lies close to the 50-day average. A move through both would mark the first real sign that buyers are taking back control.
Where November Turns for SOL
- Bullish: An oversold bounce that closes a day above $97.59 would clear that thick ceiling and open the way to the next resistance near the 50-day average. The setup fails if SOL slips back under $88.94, since that would show buyers could not hold their gains.
- Bearish: A daily close below the first support shelf would point toward $72.34. A recovery above that ceiling would cancel this view.
Adoption Headlines Wait for the Chart to Agree
Leap gives Solana a fresh adoption story, and its plan to burn SOL with future fees adds a long-term buyer. The chart has not caught up yet. The trend stays bearish until SOL wins back both averages.
Oversold markets can also squeeze hard in either direction, so sharp swings may come before any clear turn.
Disclaimer: This article is provided for informational purposes only. It is not offered or intended to be used as legal, tax, investment, financial, or other advice.
Disclaimer: This article is provided for informational purposes only. It is not offered or intended to be used as legal, tax, investment, financial, or other advice.
Related Stories