Solana Price Drop Below Its 200-Day Average Points to a 10% Fall Toward $75
 Alex Carter

Three Things to Know
- Solana has lost roughly a quarter of its value in a month as spot ETF buyers pull back.
- SOL now trades under both its 50-day and 200-day averages, with sellers firmly leading the trend.
- A support zone near $74 is the floor that could decide whether the slide deepens.
Solana's slide deepened this week, and the token has now broken under its long-term trend line. Recent ETF outflows and a wave of forced liquidations added fuel to the drop.
That break matters because SOL has fallen faster than bitcoin and ether, leaving it exposed if selling continues. Momentum gauges show the token deeply oversold. Traders now want to know whether buyers will defend the next floor or let it give way.
Solana Sheds a Quarter of Its Value as ETF Buyers Step Back
Solana has fallen much harder than its larger peers this month. Ether dropped about 20% to near $2,027 in that span, while bitcoin lost about 11%. SOL's slide was steeper than both, leaving it among the weakest large-cap tokens.
The damage looks worse over a longer stretch. SOL now trades about 72% below its peak near $293. That record came in January 2025.
Institutional money has stayed on the sidelines. U.S. spot Solana ETFs posted net outflows of about $7.7 million on Nov 9, according to fund flow data. That points to thin demand from the larger buyers who supported the token earlier.
Leverage made the selloff sharper. A wave of forced liquidations swept crypto markets on Nov 8, and smaller coins took the heaviest hits because traders hold more borrowed positions in them.
Traders expect more turbulence. Coinbase Markets data show SOL options pricing a move of up to about 9% in either direction through Nov 15.
Both Key Averages Now Sit Overhead
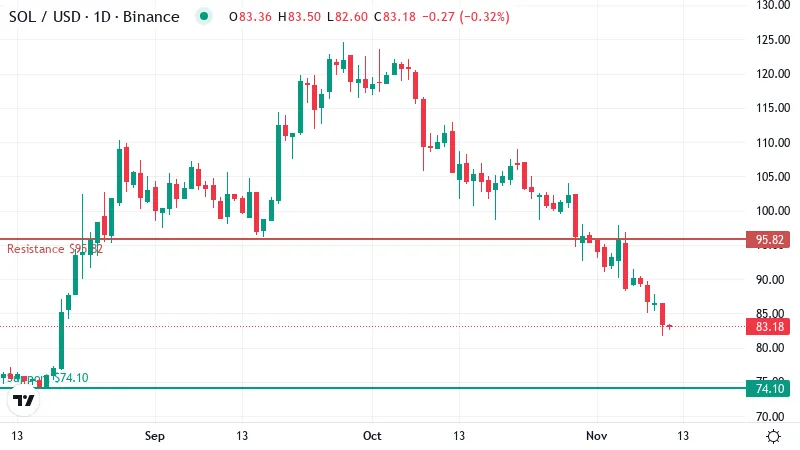
SOL traded near $83 on Friday, flat on the day. The token lost about 10% this week. That slide has carried it to the bottom of its recent range, and no real bounce has formed yet.
The bigger problem is where price sits relative to its long-term trend lines. A moving average smooths out daily swings to show the underlying direction. SOL now trades well below its 50-day average near $99. That line tracks the trend of the past few months.
SOL is also far under its 200-day average near $97, a gauge of the longer trend. When price holds below both averages, they tend to act as ceilings on any rally. Sellers often step in as price climbs back toward them.
Those lines have drifted very close together. The 50-day line still sits slightly above the 200-day, but the gap has nearly closed. If weakness continues, the shorter average could cross below the longer one. Traders call that a bearish crossover and read it as confirmation that the trend has turned down.
Buyers would need to reclaim both lines to change that picture.
Sellers Stay in Charge Despite Oversold Readings
The momentum picture adds a twist. RSI, a 0 to 100 gauge of momentum, sits near 24 on the daily chart. Readings below 30 count as oversold, meaning the selling has run unusually hard and fast.
Oversold conditions often come before a relief bounce. Short sellers lock in profits, and bargain hunters test the waters. That kind of bounce can be brief, though, and it does not mark a turn in the trend by itself.
Other gauges show the pressure is still on. MACD, a tool that tracks shifts in momentum, remains below its signal line. That means downside momentum has not faded yet.
Trend strength readings show a firm trend led by sellers. Until that changes, rallies may struggle to last.
Why $74.10 Is the Floor That Matters
On the daily chart, the nearest support sits near $74. That level lines up closely with SOL's Aug 16 close around $75, a spot traders have flagged as the next likely target.
The zone matters because little else stands beneath it. A close under it could leave SOL with few natural places for buyers to regroup.
In that case, attention would likely shift to the June 6 close near $62. That marked the token's lowest close in a year, and a return there would erase months of gains.
Bulls face a steep climb in the other direction. The first resistance sits near $96, just under both averages. Above that, the round number of $100 would need to fall before the trend looks repaired.
Relief Bounce or Another Leg Lower
- Bullish: A daily close back above the 200-day average would be the first sign that buyers are absorbing the selling. That move could set up a relief bounce toward the averages overhead. A slide back under current prices would cancel the setup.
- Bearish: A close below $80 would expose the support zone near the August low. A recovery above first resistance, just under both averages, would undo that bearish case.
The Burden of Proof Rests on SOL Bulls
Sellers still control the trend. Until buyers retake the averages overhead, the path of least resistance points toward the mid-$70s.
Traders should still expect sharp swings. Oversold momentum and heavy leverage can fuel sudden short squeezes, and those can unwind just as fast. Returning ETF demand would be the clearest sign that bulls are back.
Disclaimer: This article is provided for informational purposes only. It is not offered or intended to be used as legal, tax, investment, financial, or other advice.
Disclaimer: This article is provided for informational purposes only. It is not offered or intended to be used as legal, tax, investment, financial, or other advice.
Related Stories