NEAR Longs Lose $210K on Binance, Bybit and OKX as the Price Breaks Below $3
 Alex Carter

Three Things to Know
- NEAR long traders lost about $210,000 in a single hour as the token broke below a key round number.
- The rebound has lifted NEAR back above its 200-day average, but only by a thin margin.
- The $3 mark now decides whether the bounce holds or sellers take back control.
Leveraged buyers in NEAR Protocol were forced out across three major exchanges as a broad crypto selloff dragged the token lower. Liquidation data pointed to heavy selling pressure during the drop.
The token has since clawed back some ground, but sellers still set the trend. Traders now watch whether buyers can defend the long-term average.
A $210K Long Squeeze Sends NEAR Under $3
NEAR Protocol slipped below $3 during a broad selloff across the crypto market. The token traded near $2.94 on Binance at the low. The drop of about 3.7% in a single hour extended a 24-hour slide of roughly 14%.
Leveraged buyers took the hardest hit. Exchange liquidation data showed long positions wiped out in that same hour across Binance, Bybit and OKX. Traders read the flush as a sign of significant selling pressure.
Each forced closure added fuel to the decline. When a long position is liquidated, the exchange sells the trader's tokens at market. That selling pushed the price lower and triggered the next round of margin calls.
The cascade did not last. NEAR has since bounced back above the round number as buyers stepped in after the washout.
The Bounce Lands Right on the 200-Day Average
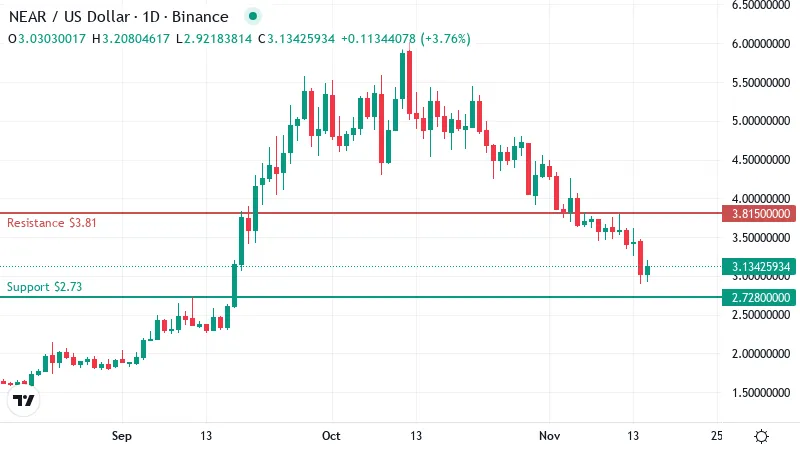
NEAR now trades around $3.13, up about 4% over the past day. That rebound has carried the token back above its 200-day moving average, which sits near $3.02. The 200-day average tracks the mean closing price over roughly the past ten months. Traders watch it as the dividing line between a long-term uptrend and a downtrend.
The margin above that line is thin. NEAR holds only about a dime over the average, so one more bad hour could drag it back underneath. For now, the 200-day line acts as a floor and still points to a healthy long-term picture.
Over a shorter horizon, the picture looks weaker. The 50-day moving average stands near $3.99, well above the current price. That gap means the past two months of trading have been heavy, and the 50-day line now works as a ceiling that buyers would need to clear.
A recovery to that level would take a gain of more than 25% from here. Nothing in the recent tape suggests that kind of demand is building.
The broader slide puts the bounce in context. NEAR is still down about 16% over the past week and roughly 40% over the past month. Against losses of that size, the daily gain is a small step. Dip buyers exist, yet the damage from the selloff remains.
Sellers Still Hold the Momentum Edge
The daily RSI, a 0 to 100 gauge of momentum, sits at 33. That reading is weak. It also sits just above the oversold zone below 30, where selloffs often run out of steam. NEAR has not reached that point of exhaustion yet, so there is still room for another leg lower before sellers tire.
Another gauge, the MACD, points the same way. This indicator compares short and longer-term price averages to show which way momentum is turning. It remains below its signal line, which means momentum is still pointing down even after the rebound. A true shift usually shows up as a cross back above that line.
Trend strength readings add weight to the bearish case. They show a real trend in place, and sellers are the ones driving it. Bounces inside a trend like this often fade.
Where the Next Floor and Ceiling Sit
The nearest support sits near $2.73, below the liquidation low. Buyers would likely defend that zone first if the selling resumes. On the daily chart, it marks the next shelf where demand showed up before.
Losing that level would expose a much deeper floor near $2.21. A drop that far would erase the rebound and extend the monthly slide.
Overhead, the first resistance stands near $3.81. NEAR needs to reclaim it to show that a real relief rally is underway. That level sits just under the 50-day line, so the two form a heavy ceiling together.
A clean break above it would bring the next resistance near $4.28 into view. For now, the round-number mark matters most. A daily close back under it would hand control back to sellers.
Two Paths From the $3 Pivot
NEAR's next move depends on how it trades around the round-number pivot.
- Bullish: Buyers keep the price above the 200-day average and grind toward first resistance just under the 50-day line. A daily close below that long-term average would cancel this path and show the bounce has failed.
- Bearish: A fresh wave of long liquidations breaks first support below the recent low, opening the way to the deeper floor. A reclaim of first resistance would invalidate this view and signal that sellers have lost their grip.
A Relief Rally That Still Needs Confirmation
NEAR's rebound looks like relief after a forced selloff. Sellers still lead the trend, and momentum has not turned, so the bounce stays fragile until buyers clear the 50-day line.
The wider market remains the main risk. If crypto weakness returns, leveraged longs could unwind again just as quickly.
Disclaimer: This article is provided for informational purposes only. It is not offered or intended to be used as legal, tax, investment, financial, or other advice.
Disclaimer: This article is provided for informational purposes only. It is not offered or intended to be used as legal, tax, investment, financial, or other advice.
Related Stories