Hyperliquid Price Slips Below the $69.70 200-Day Average as Sellers Press the Last Support Zone
 Alex Carter

Three Things to Know
- Hyperliquid kept sliding this month even after fresh exchange listings and a reopening of withdrawals on Binance.
- HYPE has dipped just under its 200-day average, the same line that launched a rally in the spring.
- Everything now hinges on whether buyers can hold a tight support band in the high $60s.
Hyperliquid's token slipped beneath its 200-day moving average this week. New listings in South Korea and strong buyback revenue failed to stop the decline.
That matters because HYPE has leaned on this line before, and the last test ended in a multi-month rally. This time, momentum is weaker and whales have already sold. Traders now want to know whether buyers will defend the floor again or let price drop toward summer lows.
Good News Fails to Stop the Hyperliquid Slide
Hyperliquid's daily chart turned bearish over the past two weeks. HYPE set a lower high on Oct 30, after a spike tied to the ICE futures announcement faded. It then printed its first lower low since the August breakout.
A run of good news failed to turn the tide. Binance reopened HYPE withdrawals on Nov 8, and Upbit and Bithumb listed the token on Nov 10. On-chain data shows two large holders sold about $109M of HYPE on Oct 31, and that supply weighed on price.
The business itself looks healthy. DefiLlama data shows $68.68M in revenue over the past 30 days, all routed to holders through buybacks. That pace works out to roughly $825M a year. About 19% comes from yield on USDC reserves. Analyst Jussy highlighted that strength, though the buybacks only slowed the selling.
Market mood is grim, with the Fear & Greed Index at 20. HYPE sits about 26% below its Sept 23 record of $97.99. It still beats Bitcoin this year, since BTC is down about 15% year to date.
HYPE Now Sits on the 200-Day Line That Sparked April's Rally
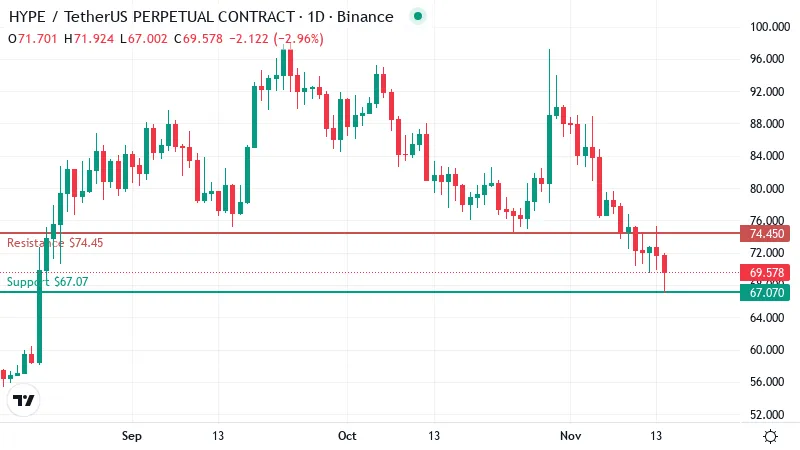
HYPE traded near $69.56 at last check, just under its 200-day moving average at $69.70. That average tracks the mean closing price over roughly the past ten months. Slipping below it means the long-term floor is now being tested from underneath.
The 50-day average sits much higher, near $79.86. Price is trading well beneath it, so the short-term trend points clearly down. That line now acts as a ceiling for any bounce.
Losses have built steadily across timeframes. HYPE fell about 3% in a day and about 11% in a week. It is down about 14% on the month, a slow grind lower with no single panic flush.
HYPE also lost the 0.382 Fibonacci retracement near $75. That level had held twice since September, and buyers failed to defend it a third time. Former support often turns into resistance once it breaks.
History makes the 200-day line important. Price tested it in April, held, and then rallied from May onward. Traders now watch the same line to decide the medium-term trend. A repeat of April would need buyers to show up here, while a clean break would hand sellers the next leg.
Sellers Keep Control as Momentum Sinks Toward Oversold
The Relative Strength Index, or RSI, is a 0 to 100 gauge of momentum. On the daily chart it reads 32, its lowest level since August. That puts HYPE close to the oversold line at 30, though it has not crossed it yet.
Other momentum signals offer no relief. The MACD sits below its signal line, which means momentum is still pointing down. Trend gauges show sellers leading a newly forming trend.
Trading volume has shrunk steadily since its April and June peaks. That pattern points to buyers drifting away while holders sell slowly. A lasting bounce would need fresh demand to return in size.
Where Buyers Must Step In Before $61 Comes Into View
The support zone stacks three levels in a tight band. The lower edge of HYPE's ascending channel runs near $70. The 0.5 Fibonacci retracement sits at about $68.08, and the nearest chart support comes in around $67. Buyers already reacted once at $69.91, which shows some demand still lives here.
Losing $67 on a closing basis would break that cluster. The next chart support sits near $57, and the 0.618 Fibonacci level at $61 lies along the way. That area marks the June to July consolidation, where price spent weeks moving sideways. Such zones often attract buyers again, though the trip down would erase much of the summer's gains.
Bulls face a clear task on the upside. They first need to reclaim resistance near $74.50, the old floor that recently gave way. Above that, the next barrier sits near $82.60, close to the 50-day average.
Two Paths Out of the $67 to $70 Zone
The next daily close around this zone will likely set HYPE's direction.
- Bullish: Buyers defend the 200-day average and push price back above $74.45. That would open a run toward $82.61 and revive the April playbook. A close under the support band would cancel this setup.
- Bearish: A daily close below $67.07 breaks the support cluster. Sellers would then aim for the 0.618 Fibonacci level first, then $57.05. A move back above $74.45 would undo this view.
History Favors Bulls Only If the Line Holds
HYPE now rests on a key floor. Steady buyback revenue gives bulls a real argument, and the April bounce shows this line can hold. For now, though, the trend belongs to sellers.
Fear across the market remains extreme, and big holders have already shown they will sell. Another large exit could push price through support quickly.
Disclaimer: This article is provided for informational purposes only. It is not offered or intended to be used as legal, tax, investment, financial, or other advice.
Disclaimer: This article is provided for informational purposes only. It is not offered or intended to be used as legal, tax, investment, financial, or other advice.
Related Stories