HYPE Beats Bitcoin by 200% on Buybacks, DWF Labs Finds, Yet Sheds $1.85B in a Week
 Alex Carter

Three Things to Know
- A new DWF Labs study finds most tokens with buyback programs beat Bitcoin this year, and HYPE led the pack.
- HYPE has slipped under its 50-day average, and momentum gauges still favor sellers.
- The support zone resting just above the 200-day average now decides whether the long uptrend survives.
Hyperliquid's token tops a new ranking of crypto buyback programs. DWF Labs found that nearly every token returning value to holders outperformed Bitcoin in 2026, with HYPE far ahead of the field.
The win comes with a catch. Last week's selloff erased more market value than the protocol has spent buying its own token, and ETF money flowed out. Traders now want to know whether steady buybacks can hold the long-term trend in place.
Buyback Tokens Outrun Bitcoin as HYPE Leads the Pack
Tokens that buy back their own supply have crushed Bitcoin this year. A DWF Labs study released Nov 9 found that 13 of 15 cryptos with buyback or value-return programs outperformed the largest coin. Hyperliquid's HYPE led the group, up more than 200% year to date as of Oct 27. Pump.fun's PUMP followed with a gain above 120%, while Bitcoin fell 14.5% over the same stretch.
Hyperliquid sends 95% to 99% of its revenue into HYPE purchases through its Assistance Fund. Those buybacks now total over $1.26B. That equals about 6.9% of the token's market cap.
The program could not stop last week's slide. HYPE shed about $1.85B in market value in seven days, more than every dollar spent on buybacks. U.S. Hyperliquid ETFs posted net outflows of $8M on Nov 6. The token peaked at $98 on Sept 23.
Some news cut the other way. Binance resumed HYPE withdrawals. The Elysium layer-2 network went live Nov 9 and uses HYPE for gas. Hyperliquid futures also earned $2.8M in fees over 24 hours on Nov 7.
HYPE Slips Under Its 50-Day Average but Keeps the Long Trend
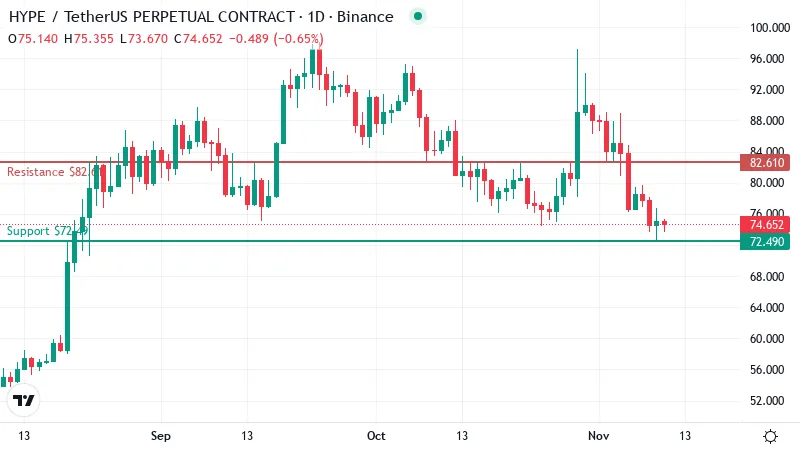
HYPE traded near $74.60 on Sunday, flat on the day. The calm session follows a rough week. The token has lost about 11% in seven days, and the selling pushed it under its 50-day moving average.
That average, which tracks the mean closing price over the past 50 sessions, now sits near $81.41. Price below it means the line tends to act as a ceiling. Any bounce will likely meet sellers there first.
The longer picture still looks intact. HYPE remains above its 200-day average, near $69.65. Traders often treat that slower line as the dividing mark between a long-term uptrend and a downtrend. As long as price stays above it, the rally that started at the end of 2025 has not been broken.
HYPE has dropped out of its recent trading range without falling into a deeper decline.
Across 30 days the token is down about 13%. Most of that loss came in the last week, after a slow fade through October. A steady drip of selling drove it, pulling the price lower even as the buybacks continued.
Sellers Still Hold the Momentum Edge
HYPE's daily RSI, a 0 to 100 gauge of momentum, reads about 38. That sits in weak territory, below the neutral middle band. It is still well above 30, the line that marks oversold conditions.
An oversold reading often signals that sellers are running out of steam. HYPE has not reached that point, so the token still has room to slide before a bounce looks likely.
The MACD, which compares short and long price trends, sits below its signal line. In plain terms, momentum is still pointing down. Trend strength readings also show a move taking shape, with sellers in control. Neither gauge has flashed a reversal yet.
Why $72.49 Decides the Next Leg
Nearest support sits near $72.49, a short step below the current price. That floor rests just above the 200-day average, so the two levels work as one zone. Buyers have a clear line to defend.
A drop under that zone on a closing basis would change the picture. It would put HYPE below its long-term trend line for the first time since the rally began. The next support on the daily chart waits near $63.77, which leaves a lot of open air below.
The upside map is tighter. Resistance stands near $82.61, just above the 50-day average. A move back over that level would put price above both, and it would ease the selling pressure that has built through the week.
The next ceiling sits near $84.64, close behind the first. A rebound would need to clear both before traders start talking about the old highs again.
Two Paths for HYPE Into Midweek
Both setups for the week hinge on the levels mapped above.
- Bullish: A daily close above first resistance would put HYPE back over the 50-day line and open a run at the next ceiling just behind it. Fresh ETF inflows and steady fee income would help that case. The setup fails if price drops back under nearest support.
- Bearish: Settling below that support and the 200-day average would point toward the lower floor on the daily chart. The setup fails if buyers reclaim the 50-day average.
Buybacks Need Buyers Behind Them
Sellers control the short term until HYPE wins back its 50-day average. The flywheel keeps turning, but it cannot carry the price alone. More ETF outflows could swamp the buybacks and push HYPE under its long-term floor.
Disclaimer: This article is provided for informational purposes only. It is not offered or intended to be used as legal, tax, investment, financial, or other advice.
Disclaimer: This article is provided for informational purposes only. It is not offered or intended to be used as legal, tax, investment, financial, or other advice.
Related Stories