Here's What Needs to Happen for Sui Price to Hit $1 Again After the Slide to $0.86
 Alex Carter

Three Things to Know
- Sui has given back a large share of its fourth-quarter value as leverage drains from the market.
- Price trades under both long-term moving averages, a bearish order that keeps sellers in charge.
- A daily close above the 50-day line near $0.95 is the first test for any run at the round number.
Sui slipped again on Monday, extending a fourth-quarter decline that has pushed the token well below where it started October. Futures traders have pulled money out, yet longs keep paying to hold their positions.
That mix matters now because the selling has been orderly, with no flush to reset positioning. Buyers have not shown up in size on spot markets.
Sui Bleeds Leverage as Sellers Drive the Fourth Quarter Slide
Sui has slid steadily since the fourth quarter began, dropping from about $1.30 to a low near $0.82. Traders now watch the $0.8415 area as the line that matters. A daily close below it could expose $0.80.
Derivatives data shows leverage leaving the market. Aggregated open interest fell to about $255.6 million, down from more than $400 million at the October peak. Funding rates remain positive, which means longs are still paying shorts to keep their bets open.
Order flow tells a similar story. Cumulative volume delta (CVD), which tracks whether aggressive buyers or sellers dominate, is trending down in both spot and futures. Spot demand looks thin. Chaikin Money Flow, a gauge of buying and selling pressure, is barely positive.
Liquidations have not spiked the way they do in a capitulation flush. Without that reset, the outlook stays cautious until real demand returns.
Both Long-Term Averages Now Sit Overhead
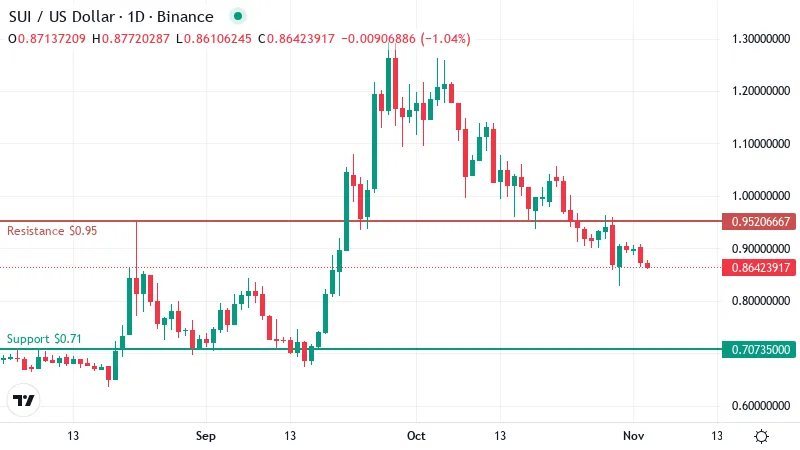
Sui changed hands near $0.86 at last check, and both of its long-term trend lines now sit above it. The 50-day moving average, which tracks roughly ten weeks of closing prices, stands near $0.95. The 200-day average, a slower gauge of the broader trend, sits close to $0.97.
That setup is a clean bearish alignment. Price trades under the short-term average, and the short-term average trades under the long-term one. Traders read that order as a sign that sellers control every time frame that matters.
The two averages also sit only a few cents apart. That gap is small enough that they act as one thick ceiling. Any bounce toward $1 has to push through this band first. Rallies often stall at a cluster like this. Holders who bought higher tend to sell into the move to get out near breakeven.
Recent losses explain why the band feels so far away. SUI has lost about 27% over the past 30 days, leaving it pinned near the bottom of that range. The past week brought no relief either, with the token down roughly 6% over seven days.
Sellers have kept pressing, and buyers have not stepped in with enough size to slow the decline.
Sellers Keep Their Grip Without Panic
The daily Relative Strength Index (RSI), a 0 to 100 gauge of momentum, reads about 36. That is weak, yet still above the oversold mark at 30. Sellers have room to push further before the indicator flags exhaustion.
SUI also slipped about 1% over the last 24 hours. That small move fits the steady pattern of recent weeks.
Meanwhile, the MACD indicator, which compares short and long price averages, sits below its signal line. Momentum is still pointing down. The trend strength reading confirms a real trend, and sellers are the ones leading it.
That mix describes an orderly decline. Nobody is dumping in a rush, and buyers are staying on the sidelines. Without a flush to clear out late longs, the grind lower can continue.
$0.95 Is the Gate to a Run at $1
On the daily chart, the first resistance lines up with the 50-day average. Closing above it would put SUI back over its shorter trend line for the first time in weeks.
Clearing that ceiling would also bring the 200-day average and the round-number target into reach. Above them, the next resistance sits near $1.06. A push to that area would mean the fourth-quarter slide had stalled.
The downside map looks less friendly. If the floor traders flagged earlier gives way, the chart shows little support until about $0.71.
Below that sits a second floor near $0.64. A slide that deep would likely require the liquidation flush that has been missing so far.
Where the Next Three Days Could Take Sui
Two paths stand out for the token.
- Bullish: Buyers defend the floor traders flagged earlier, then force a daily close above the 50-day line. That would put the next resistance zone above the round number in play. A close back under that same floor would cancel the setup.
- Bearish: A daily close beneath the round support just under the floor would open a drop toward the first chart support below. A recovery above the 50-day line would cancel this path and hand momentum back to buyers.
Demand Has to Return Before $1 Does
For now, SUI belongs to the sellers. The token needs a daily close back above both long-term averages before a return to the round number looks realistic. The main risk sits in derivatives. Longs are still paying positive funding, and no flush has cleared them out. That leaves room for a sharp long squeeze if the floor breaks.
Disclaimer: This article is provided for informational purposes only. It is not offered or intended to be used as legal, tax, investment, financial, or other advice.
Disclaimer: This article is provided for informational purposes only. It is not offered or intended to be used as legal, tax, investment, financial, or other advice.
Related Stories