Here's What Needs to Happen for Bitcoin Price to Hit $80,000 After a 10% Monthly Drop
 Alex Carter

Three Things to Know
- Bitcoin has lost about a tenth of its value in a month, extending a slide that began last year.
- Price now sits below both of its key moving averages, and momentum gauges still favor sellers.
- The 200-day average near $76K is the first ceiling buyers must clear before any run at the headline target.
Bitcoin started the week on the back foot, holding near its lowest levels in months after a steady decline since early October. The daily move looked calm, but the monthly loss tells a rougher story.
The drop leaves recent buyers underwater and ready to sell into strength. Traders now want to know whether demand can return fast enough to lift the coin back over its long-term trend line, or whether the slide still has room to run.
Bitcoin Sheds a Tenth of Its Value in a Month
Bitcoin traded near $74,260 early on Nov. 10, 2026. That was down about $289 from the prior day. That is a dip of roughly 0.4%, small enough to look like a quiet session.
The longer view is harsher. A month earlier, BTC changed hands near $82,490, which leaves the coin down almost 10% since then. Over a year the damage is deeper still. Bitcoin sat near $106,000 a year ago and has since lost close to 30%.
This weak stretch began last year, when Bitcoin closed 2025 well below its October all-time high.
Size still favors the largest coin. Bitcoin's market value stands near $1.33 trillion, against roughly $233 billion for Ethereum. Ether traded near $2,090 and XRP near $1.07 on the same morning.
None of the usual drivers, from corporate adoption to regulation, has yet produced a clear trigger for a rebound.
Both Key Averages Now Sit Above the Price
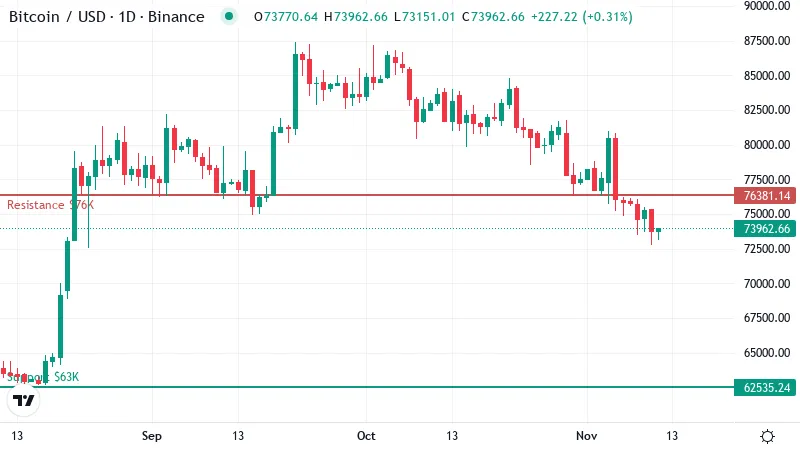
Bitcoin now trades near $74K, under both of the moving averages that traders watch most. A moving average smooths out daily swings by tracking the mean closing price over a set period. The 50-day line reflects the recent trend, and the 200-day line shows the long-term one.
The 50-day average sits near $79K. The 200-day average sits closer, around $76K. Price below both lines is a bearish setup, because each average tends to act as a ceiling on rallies.
Their order also matters. The shorter average sits above the longer one, which means recent prices have fallen faster than the long-run trend. Buyers from the past few months mostly hold losses, and many may sell into any bounce near break-even.
That makes the 200-day line the first real test. It is the nearer ceiling, only a short climb from the current price. A daily close back above it would show buyers can absorb that selling. A rejection there would confirm the long-term trend has turned against the coin.
Bitcoin dropped about 4% over the past week. Over 30 days the live data shows a decline of about 12%.
A market that is finding a floor usually shows shrinking weekly losses. Bitcoin is still adding to them, so the selling has not yet run its course.
Sellers Keep the Upper Hand Without Capitulating
Momentum readings show the same pressure. The daily RSI, a 0 to 100 gauge of how strong recent moves have been, stands at 35. That sits in weak territory, below the neutral middle band.
It is still above 30, the usual line for oversold conditions. Oversold markets often attract bargain hunters and snap back. Bitcoin has not reached that point, so sellers still have room to push lower before a reflex bounce becomes likely.
Trend gauges agree. The MACD, which compares short and long price averages, shows downward momentum has not turned yet, and trend strength readings favor sellers.
A flat 24-hour change hides that pressure. A quiet day without a sharp flush suggests holders are bleeding out slowly rather than giving up all at once.
$76K Stands Between Bitcoin and the $80K Target
The 200-day line doubles as the nearest resistance on the daily chart. Sellers have defended that level on recent tests, so it marks the first hurdle for any recovery.
Clearing it would show buyers can absorb supply from trapped holders and open the way toward $80K.
That target is the next resistance and sits just above the 50-day average, so the two ceilings overlap. A move there would mean recovering most of the past month's losses, and it would likely meet fresh selling from recent buyers.
Support below looks thin. The data shows no support until about $63K. If Bitcoin loses its current footing, few price levels stand in the way. That leaves an air pocket below the market, and a break lower could turn into a fast drop.
Two Paths for the Next Three Days
Both outcomes hinge on how Bitcoin handles the 200-day line in the coming sessions.
- Bullish: A daily close above the 200-day line would put the headline target back in play, with the 50-day average as the next test. The setup fails if Bitcoin slips back below today's trading range.
- Bearish: A rejection at the 200-day line, with RSI drifting lower, would expose the thin support zone far below. That view fails on a daily close back above the long-term average.
Recovery Has to Start at the 200-Day Line
Until Bitcoin closes back above the 200-day line, talk of a larger recovery stays premature. Momentum gauges still favor sellers, so a reclaim looks unlikely without a shift in demand.
The risk sits below. With little support until the next major floor, a failed bounce could prove expensive for buyers who step in early.
Disclaimer: This article is provided for informational purposes only. It is not offered or intended to be used as legal, tax, investment, financial, or other advice.
Disclaimer: This article is provided for informational purposes only. It is not offered or intended to be used as legal, tax, investment, financial, or other advice.
Related Stories