Ethereum Price Rejection Forecasts 13% Crash as ETF Outflows Hit $657 Million
 Alex Carter

Three Things to Know
- Ether funds shed hundreds of millions last week before a single day of inflows broke the streak.
- ETH failed to reclaim its 200-day average, and sellers still drive the trend despite a fresh MACD cross.
- The August swing-low zone is the floor that could decide whether the slide deepens.
Investors pulled money from Ether funds for a full week, and one day of fresh buying barely dented the losses. BitMine Immersion kept adding coins, but the company is closing in on its own treasury goal.
That leaves ETH with fewer reliable buyers just as the chart turns heavy. Sellers defended the long-term average again this week. Traders now want to know whether demand can return before price tests the summer low.
ETF Money Walks Out as BitMine Nears Its Ceiling
Spot Ethereum ETFs bled $657 million over the past week before buyers returned with a $53 million net inflow on Nov 4. The single green day did little to repair the damage. SoSoValue data show cumulative net inflows slid from $13.55 billion in early October to $12.12 billion.
BitMine Immersion kept buying through the slide. The company added 8,573 ETH at an average of $2,261. Its treasury now holds about 6,060,506 ETH, close to 4.9% of the total supply. That leaves the firm roughly 50,000 ETH short of its 5% target. Once it gets there, one of the market's steadiest buyers could step back.
The long-range picture looks thin as well. A ChatGPT estimate gave ETH 60% odds of reaching $3,000 by early 2027. Analysts called that generous, since the coin last traded above that level in January. ETH also sits far below its $4,946 record high.
Sellers Keep ETH Pinned Under Both Averages
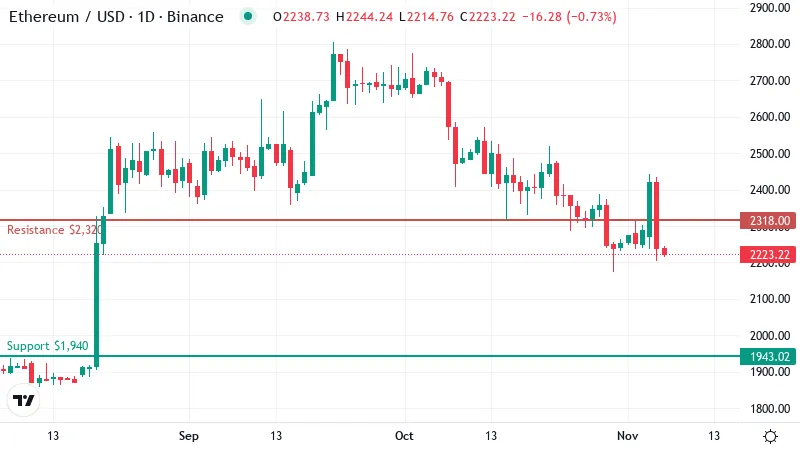
Ethereum traded near $2,220 on Thursday, stuck below both of the moving averages that traders watch most. A moving average smooths out daily swings by tracking the average closing price over a set number of days. When price sits under one, that average tends to act as a ceiling.
The 200-day average, near $2,310, did exactly that. ETH pushed toward it in recent sessions and failed to close above it. That rejection matters because the 200-day line is the market's broad read on the long-term trend. Losing it hands the advantage to sellers.
Higher up, the 50-day average sits around $2,400. That gap shows how far short-term prices have fallen behind their recent norm. Buyers would need to clear two layers of resistance before the chart looks healthy again.
Over the past month, the damage piled up. ETH has dropped about 18% over 30 days and now trades near the low end of that range.
Recent sessions look calmer. Price was flat over 24 hours and down only about 1% on the week. That quiet reads more like sellers catching their breath than buyers taking control.
Trend-strength readings back that view. The downtrend registers as a real one, and sellers are the side driving it. Until that changes, rallies toward the averages are likely to meet supply.
Momentum Stirs While RSI Stays Weak
RSI, a 0 to 100 gauge of momentum, sits at 39 on the daily chart. That reading is weak. Buyers lack the conviction to push prices higher.
The gauge has not dropped into oversold territory below 30, either. Sellers have not yet thrown in the towel in a panic. That leaves room for more downside before any washout forms a clear bottom.
One signal looks more hopeful. The MACD, which tracks shifts in trend momentum, has crossed above its signal line. That cross suggests the selling pressure is fading from its recent peak.
Traders should treat it as an early hint. A single momentum cross inside a seller-led trend often fades. Bulls need price to follow through before it counts as a reversal.
Why $1,940 Is the Floor That Matters
The first ceiling sits near $2,320, just above the 200-day average. A daily close over that level would erase the recent rejection. It would also tell traders that buyers can hold ground the sellers just defended.
Above that, the 50-day line waits as the next hurdle. Clearing both would turn the short-term picture neutral again.
The downside map is clearer. Support sits near $1,940, about 13% below current prices. That drop is the move the headline warns about, and it lines up closely with the August swing low.
ETH bottomed near $1,916 on Aug 18 before buyers stepped in hard. That history gives this zone weight, because buy orders often cluster where the last bounce started.
Losing that floor would change the tone. A clean break below the August low would leave little nearby support. The next level to watch would be around $1,850, where the chart offers its next pause.
Two Paths for the Next 72 Hours
The next three days should show whether the MACD cross has any follow-through.
- Bullish: A daily close above the first ceiling, just over the 200-day line, would open a path toward the 50-day average. ETF inflows returning for more than a single session would help. A slip back under Thursday's trading level would cancel the setup.
- Bearish: Fresh ETF outflows would likely drag ETH toward the August-anchored floor. BitMine slowing its buying would add weight. A reclaim of that first ceiling would invalidate the bearish case.
Bears Hold the Edge for Now
Until ETH closes back above the 200-day average, the bias points lower and rallies look like chances to sell.
The bigger risk sits with demand. BitMine is close to its target, and the ETF funds keep shedding money. If both buyers fade together, the market loses a key cushion just as support gets tested.
Disclaimer: This article is provided for informational purposes only. It is not offered or intended to be used as legal, tax, investment, financial, or other advice.
Disclaimer: This article is provided for informational purposes only. It is not offered or intended to be used as legal, tax, investment, financial, or other advice.
Related Stories