Ethereum Price Likely to Provide Another Selling Opportunity as $1,900 Comes Into View
 Alex Carter

Three Things to Know
- Bitmine added more ether to a treasury that already ranks among the largest anywhere.
- Ether trades under both key moving averages, and sellers still control the broader trend.
- A floor just above the $1,900 zone now stands as the line bulls cannot afford to lose.
Bitmine kept buying ether this week, adding to a stake that now covers a sizable slice of the token's supply.
That corporate demand has slowed the selling without reversing it. Ether still trades below its long-term trend line after a painful month. Traders now want to know whether treasury buyers can defend the next floor, or whether any bounce becomes another exit point.
Bitmine Keeps Buying While Ethereum Keeps Sliding
Bitmine Immersion Technologies (NYSE: BMNR) bought nearly $20 million of Ethereum in its latest purchase. The company now holds 6.06 million ETH. That stake equals about 4.9% of the token's 122.2 million total supply.
The company said its combined crypto, cash and marketable securities reached $14.5 billion. Chairman Tom Lee pointed to the market's resilience after the Binance hack. He also cited demand tied to AI infrastructure as a reason for confidence.
Investors cheered the move. BMNR shares rose about 4% on the day, and ETH gained about 2%.
The risks are real, though. The company has less than one year of cash runway. Its heavy concentration in a single asset also leaves it exposed to regulatory changes and security events.
For the market, Bitmine acts as a large and steady buyer underneath the price. That demand has not stopped the slide over the past month, and ether still trades well below its October levels.
Ethereum Trades Under Both Averages After a Weak Month
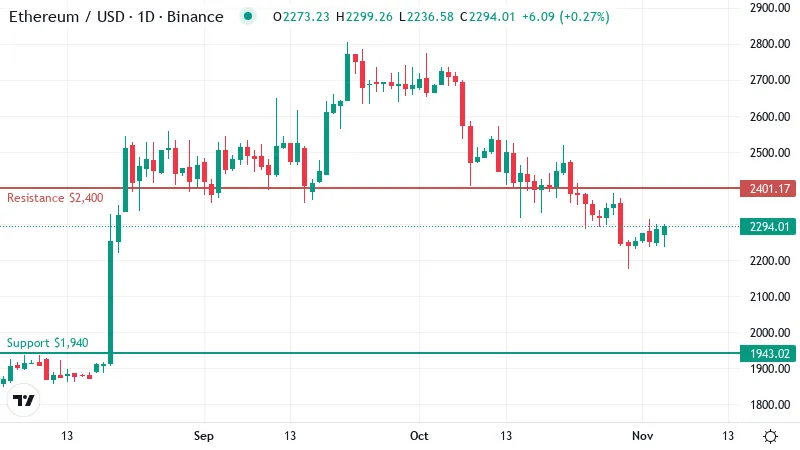
Ether traded near $2,290 on Tuesday, flat over the past 24 hours. The Bitmine purchase did little to lift the price. The price sits just under the 200-day moving average, which stands near $2,310.
A moving average tracks the mean closing price over a set number of days. Traders use the 200-day line to judge the long-term trend. When price holds below it, that line tends to act as a ceiling on rallies.
The picture looks weaker on the shorter view. Ether trades even further below its 50-day average, which tracks the past two months or so. The faster average sits above the slower one, and price sits under both. Chart readers call that a bearish stack. It means recent buyers are mostly underwater and may sell into any bounce.
Ether has lost about 16% in 30 days. The past week brought only a small additional dip. The steep October selling has slowed, but buyers have yet to turn it around.
Treasury buyers such as Bitmine appear to be soaking up coins that sellers put on the market. That demand keeps the price from sliding faster. It has not been strong enough to push ether back above its averages.
Sellers Still Lead Even as Momentum Stops Worsening
The Relative Strength Index (RSI), a 0 to 100 gauge of momentum, reads about 40 on the daily chart. That puts ether in weak territory. It sits well above the oversold zone below 30, where selling often runs out of steam. In practice, sellers still have room to push the price lower before the market looks stretched.
Short-term momentum has improved slightly. The MACD, which compares a fast and a slow moving average, has crossed above its signal line. That shift often marks a pause in selling. On its own, it rarely confirms a new uptrend, especially while price stays under both key averages.
Trend-strength readings show a real downtrend, and sellers are driving it. Bounces inside a trend like this tend to fade near resistance. Traders who bought higher may use any lift to exit, which caps the upside until buyers show more force.
$1,940 Is the Floor Before the $1,900 Zone Opens Up
Support sits near $1,940, the first real floor below current prices. Bitmine's steady buying could help cushion the price there, since treasury demand tends to show up on dips.
A daily close below that floor would weaken the case for a bounce. The next support waits near $1,840. A drop to that area would extend the monthly slide and test how deep corporate buyers are willing to step in.
On the upside, first resistance sits near $2,400. That level matches the 50-day average, which makes it a natural spot for sellers to return.
The next ceiling stands near $2,560. A clean break above it would snap the pattern of lower highs built over the past month. Until then, the downtrend structure stays intact.
Where the Next Three Days Could Take Ether
- Bullish: A daily close above the 50-day average would open the way toward the next ceiling. Buyers would then be testing the top of the recent range. A slip back under the 200-day line would cancel this setup.
- Bearish: A rejection at the 50-day average, or a break of the nearest floor, would point toward the lower support. That would extend the downtrend. A close above the higher ceiling would invalidate this view.
Rallies Remain Sell Candidates for Now
Until ether reclaims its 50-day average, bounces look like chances for sellers to lighten up. Bitmine's purchases may slow the decline, yet the trend still points down.
The main risk sits outside the chart. A sudden hack or regulatory shock could hit ether hard. It would also hurt treasury firms that hold little else.
Disclaimer: This article is provided for informational purposes only. It is not offered or intended to be used as legal, tax, investment, financial, or other advice.
Disclaimer: This article is provided for informational purposes only. It is not offered or intended to be used as legal, tax, investment, financial, or other advice.
Related Stories