ETH Hits a Sell Wall Near $2,300 as Wall Street Keeps Unloading Ethereum
 Alex Carter

Three Things to Know
- Large funds keep selling Ethereum while whales quietly add to their holdings.
- ETH trades below both its 50-day and 200-day averages, and momentum still favors sellers.
- A cluster of resistance near $2,300 has capped every recent bounce, and buyers have yet to crack it.
Institutional investors are still cutting their Ethereum exposure, while on-chain data shows large holders buying the coins the funds are dumping.
That tug of war has slowed the decline in ETH without reversing it. Sellers still control the trend, and the overhead averages have turned into a ceiling. Traders now want to know whether whale demand can outlast fund selling, or whether it will give way first.
Wall Street Sells While Whales Quietly Buy Ethereum
Market data around Nov 9, 2026 shows a steady pattern of selling from Wall Street desks and funds. That supply has hit the market week after week.
A different group is taking the other side. On-chain data points to large holders, known as whales, adding ETH to their wallets during the same stretch. These buyers usually hold big balances and tend to trade less often than funds.
The result is a market split between two camps. One side is cutting exposure, while the other treats lower prices as a chance to build positions.
That split shapes how the price behaves. Whale bids can soak up some of the institutional selling and slow the slide. Reversing the downtrend would require buyers to outpace sellers, and so far they have only kept up.
Ethereum Trades Under Both Key Averages After a 15% Monthly Slide
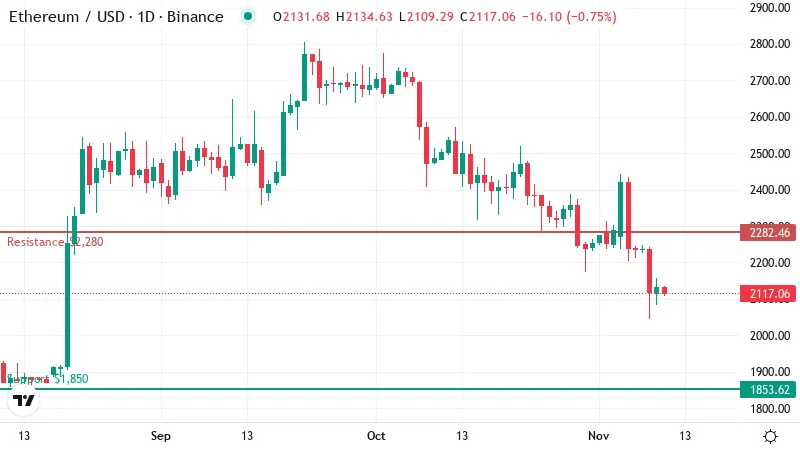
Ethereum traded near $2,120 on Monday, flat over the past 24 hours. The quiet day comes after a rough month. ETH has lost about 15% over 30 days and about 6% in the past week alone.
The losses arrived steadily, with no single crash, which is how large funds usually exit a position. They sell in pieces over many sessions, and the price drifts lower with each round.
The chart now puts the coin under both of its key moving averages. A moving average tracks the average closing price over a set period and helps show the broader trend. The 200-day average sits near $2,310. The 50-day average sits higher, near $2,360.
Both lines are above the current price, so they act as a ceiling. Rallies toward that zone tend to meet sellers who want out near their break-even level. This cluster is the sell wall that has capped recent bounces.
The 50-day line also sits above the 200-day line. The 50-day was set during stronger weeks and has not yet caught up with the slide. As it falls, the two averages may squeeze even tighter overhead.
Monday's quiet trade is the first sign of a pause. Whale buying appears to be absorbing some supply. One steady day leaves the trend intact, yet it shows buyers are present at these levels.
Sellers Still Steer Momentum Despite Oversold Edges
RSI, a 0 to 100 gauge of momentum, sits at 33 on the daily chart. That weak reading shows sellers have had the upper hand for weeks. It still sits above 30, the line most traders treat as oversold.
That gap matters for anyone hoping to buy the dip. Coins often find a bounce once RSI drops below 30 and sellers run out of steam. ETH has not reached that zone yet, so the price has room to slide further first.
Other signals agree. The MACD still points down, and trend strength readings show a seller-led downtrend taking shape.
Together these gauges offer no reversal signal yet.
Where Whale Bids Need to Show Up
Overhead, the first test sits near $2,280. That level lies just under the 200-day average and marks the front edge of the resistance zone. Funds looking to exit have used rallies into this area to unload, so buyers would need real volume to push through.
A daily close above it would be the first sign that whale demand is beating institutional supply. The next hurdle would then come near $2,400, just past the 50-day line. Clearing both averages would flip that ceiling into a floor.
Below the price, support forms a tight band between about $1,850 and $1,860. This is where whale accumulation faces its real test. Large holders who have been buying the decline would be expected to defend it with fresh bids.
If they step back, the band offers little cushion. A clean break lower would expose ETH to deeper losses, with no nearby level on the chart to slow the fall.
Two Paths for ETH Over the Next Three Days
- Bullish: A daily close above first resistance would show whale bids winning. That opens a move toward the 200-day average and then the second hurdle past the 50-day line. A drop back under Monday's trading range would cancel this setup.
- Bearish: A break below the support band would extend the slide into open space on the chart. A reclaim of first resistance would invalidate this view and ease the pressure from sellers.
Whale Buying Has Not Yet Beaten the Trend
For now, the bias stays bearish. ETH needs to reclaim the resistance overhead before that view changes. Whale buying has steadied the price without lifting it.
The main risk is a fresh wave of fund selling. If funds speed up their exits, whale demand could be swamped quickly.
Disclaimer: This article is provided for informational purposes only. It is not offered or intended to be used as legal, tax, investment, financial, or other advice.
Disclaimer: This article is provided for informational purposes only. It is not offered or intended to be used as legal, tax, investment, financial, or other advice.
Related Stories