ETH Foundation Wallet Sells 2,000 Ethereum as ETF Exits Run 87 Times Bigger
 Alex Carter

Three Things to Know
- An Ethereum Foundation-linked wallet sold more ETH this week, while spot ETF redemptions dwarf its sales.
- Ether looks deeply oversold on the daily chart, but momentum still favors sellers.
- The lost $2,000 mark now decides whether any bounce turns into a real recovery.
A wallet tied to the Ethereum Foundation kept selling ether this week, splitting its latest sale into two quick orders on CoW Swap.
The bigger drain comes from US spot ETFs, where investors have pulled money in almost every November session. That steady fund selling has pushed ether to multi-month lows. Traders now want to know whether an oversold market can bounce while redemptions keep arriving.
A Foundation Wallet Sells While ETF Investors Head for the Exit
An Ethereum Foundation-linked wallet sold 2,000 ETH on Nov 13, according to on-chain tracker Lookonchain. The sale went through CoW Swap in two orders of 1,000 ETH each, placed minutes apart. It brought in about $3.87 million.
The move fits a steady pattern. The wallet has now sold 4,000 ETH in November, worth roughly $8.03 million. An Oct 26 sale of 2,785 ETH brought in $6.42 million. That lifts its total since late October to 6,785 ETH. It still holds about 11,000 ETH, valued near $21.3 million, so more sales remain possible.
Those numbers look small next to the funds. US spot Ethereum ETFs posted $695.9 million in net outflows in November, according to SoSoValue data. That is about 87 times the wallet's sales this month. Seven of eight November sessions ended with money leaving.
Net assets in the funds stood at $13.22 billion on Oct 30. By Nov 11, they had fallen to $11.65 billion. ETF investors cashing out create the real supply pressure, and the wallet adds only a sliver.
Ethereum Trades Far Beneath Averages That Now Sit Together
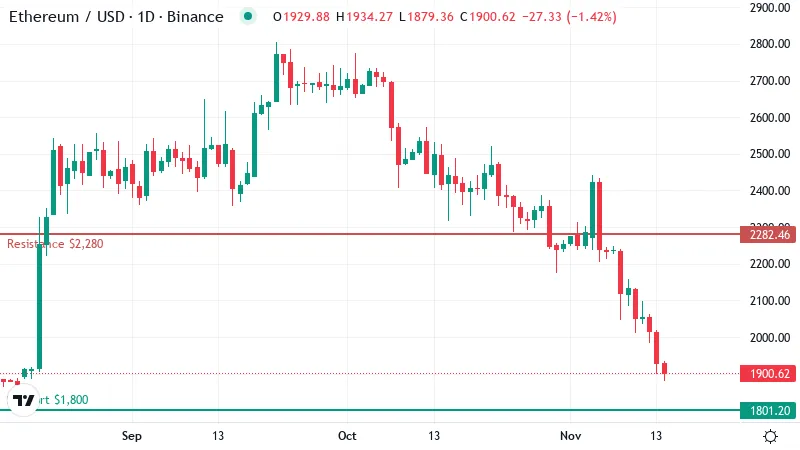
Ether changed hands near $1,900 on Thursday, down about 1% over the past day. The daily move looks mild, but the wider trend is harsher.
A moving average smooths out daily swings to show the typical price over a set period. Ethereum now trades well below its 50-day average near $2,300. It also sits under its 200-day average, which stands close by at about $2,290. When price runs under both lines, those averages tend to act as a ceiling on any bounce.
The two averages have drifted almost on top of each other. Buyers who push the price higher would meet both lines in the same narrow band, so the zone forms one thick layer of resistance.
Losses have built up over weeks. ETH dropped about 15% in seven days and roughly 21% in a month. That steady bleed points to persistent selling pressure, the kind that wears down buyers over time.
Ether's break below $2,000 marked the clearest turn. That round number had served as a mental floor for many holders. Once price slipped under it, the same level began to work as resistance overhead.
That slide came as ETF investors kept pulling money out, session after session.
Sellers Stay in Control Despite a Deeply Oversold Reading
RSI, a 0 to 100 gauge of momentum, sits near 23. Readings below 30 count as oversold. That means sellers have pushed the price down faster than usual, and the market looks stretched.
Oversold conditions often come before a relief bounce. They do not mark a turn by themselves, though. Prices can stay oversold for days or weeks when selling keeps coming, as it has from the funds.
Other gauges show the same caution. The MACD still points down, and trend strength readings show sellers leading a firm trend.
The signals describe a tired market that has not yet changed direction. Traders will want momentum to turn up first before treating any bounce as the start of a recovery.
Where $1,800 Fits Between Bulls and a Deeper Slide
Support sits near $1,800, the nearest level where buyers have stepped in before. The data maps no clear floor beneath it, which leaves the market exposed if that line gives way.
A break under that level could speed up the decline. Without an obvious next shelf, sellers would face little resistance, and stop orders could add to the pressure.
Bulls have a tougher climb. The first task is winning back the round number lost this week, since that would show buyers can absorb fund selling. Resistance near $2,280 comes next and caps the move just below the stacked averages.
Clearing that band would change the tone. A push above about $2,400 would put ETH back over both averages. That would mark a genuine repair of the trend.
Two Paths Hinge on the $2,000 Line
The next move depends on which side of the lost round number ETH settles.
- Bullish: The oversold reading sparks a bounce that wins back the round number and runs toward first resistance just below the stacked averages. A daily close back under the nearest support would cancel this view.
- Bearish: ETF redemptions keep coming and drive a daily close below that support, leaving open space with no mapped floor beneath. A recovery above the lost round number would invalidate this case.
ETF Flows Decide What Comes Next
Ether looks stretched, and sellers will run the trend until buyers reclaim the lost round number. The funds hold the key. If redemptions keep arriving session after session, the oversold reading can drag on far longer than many traders expect. Watch the daily ETF flow data for the first sign of a turn.
Disclaimer: This article is provided for informational purposes only. It is not offered or intended to be used as legal, tax, investment, financial, or other advice.
Disclaimer: This article is provided for informational purposes only. It is not offered or intended to be used as legal, tax, investment, financial, or other advice.
Related Stories