ETH Falls to $2,050 as Stakers Sit Tight Through a 20% Slide
 Alex Carter

Quick Take
- Ether stakers are holding their coins even after a slide of about a fifth in a month.
- The chart still favors sellers, with price stuck under both major moving averages and momentum pointing lower.
- A floor near $1,850 is the line that could decide whether the slide stays orderly.
Ethereum stakers are holding firm through a sharp monthly decline.
That patience keeps a large block of supply off exchanges and limits panic selling. Still, demand is thin and sellers control the trend. Traders now want to know whether locked supply can steady the price before the nearest floor gives way.
Stakers Refuse to Blink as Ether Sheds a Fifth of Its Value
The holders with the most coins locked up have stayed calm through the drop. Stakers, who park ETH with the network to help secure it and earn rewards, are neither selling nor lining up to unstake.
That restraint matters for supply. Staked coins sit locked away from exchanges, so they cannot be dumped quickly in a panic. Fewer coins on the move means less forced selling when prices drop.
The broader picture is still grim. On Nov 10, ETH traded near $2,061 after sliding 2.4% in a day. Its five-day loss reached 7.8%, a sign the selling picked up pace.
Ether was also down 30.5% for the year at that point, a weak stretch for the second-largest crypto asset.
Ether Trades Beneath Both Averages With Sellers Steering
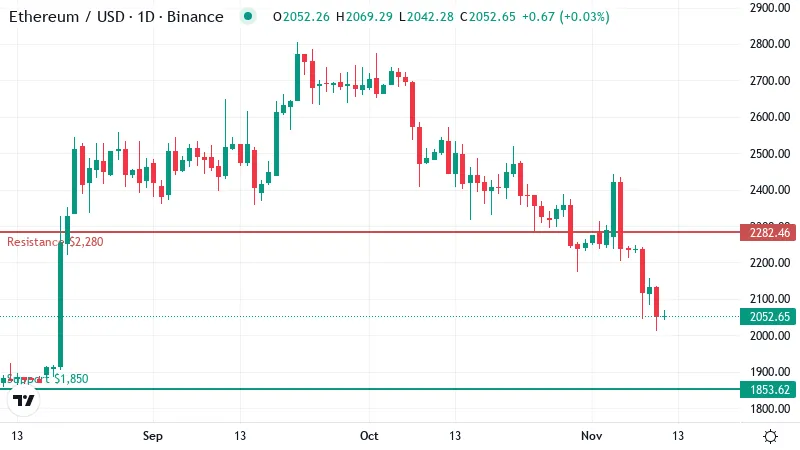
Ether now trades near $2,050, flat on the day after a rough stretch. The coin still sits below both of the moving averages that traders watch most closely.
The 50-day average, which tracks the past seven weeks or so of closing prices, stands around $2,350. The 200-day average, a gauge of the longer trend, is near $2,310. With price under both lines, each one now acts as a ceiling that buyers would have to break through.
That setup is a classic downtrend structure. The shorter average has also slipped toward the longer one, which shows recent selling has dragged down the bigger picture as well.
Ether is down about 19% over 30 days. That loss pushes the price toward the bottom of its recent range on the daily chart. The coin has spent the month making lower highs, and each bounce has faded before reaching the averages above.
Trend-strength readings confirm the decline is a genuine trend, with sellers in charge. Price is falling steadily instead of chopping sideways.
This is where the staker story meets its limit. Holding coins off the market removes potential sellers, but it adds no buyers. Locked supply alone cannot lift the price.
So far, nobody has stepped in with enough demand to absorb the selling from traders who are not staked. Until that changes, the averages overhead will likely keep capping any rally.
Momentum Nears Exhaustion Without Turning
RSI, a 0 to 100 gauge of momentum, sits at 30 on the daily chart. That reading marks the edge of oversold territory. In plain terms, sellers have pushed hard and fast, and the move is starting to look stretched.
Stretched conditions often come before a bounce, with no guarantee. Oversold readings can linger for days when a trend is strong, and this one is.
The MACD offers a second check on momentum. It remains below its signal line, so downside pressure has not flipped. Buyers have yet to show the kind of shift that usually comes before a turn.
The flat session hints that sellers are catching their breath, though a pause is no reversal. For now, momentum is tired but still pointing lower.
$1,850 Is the Floor Bulls Cannot Afford to Lose
Support sits near $1,850, the nearest level where buyers have stepped in before. No clear floor shows beneath it, so a daily close below could leave Ether with little to slow a fresh wave of selling.
Thin support below often turns a steady slide into a fast one, because stop orders cluster under obvious floors.
Overhead, first resistance stands around $2,280. That level sits just under the 200-day average, so the two form a tight band of selling pressure. Reclaiming it would ease the strain and show buyers can hold ground again.
The next barrier waits near $2,400. A push through it would put Ether back above the 50-day zone. That would mark the first real crack in the downtrend that has defined the month.
Two Paths for Ether Over the Next Three Days
Ether's next move likely hinges on which edge of its range breaks first.
- Bullish: A daily close above first resistance, just under the 200-day line, would open a run toward the next barrier overhead. The setup fails if price slips back under the current trading level, which would show buyers could not hold the breakout.
- Bearish: A break of support would leave Ether in open space with no mapped floor below. A reclaim of first resistance would cancel that view and suggest sellers had lost their grip.
Patience Holds Supply but Not Yet Price
Staker loyalty has kept coins off exchanges, but sellers still set the direction. Ether stays in a downtrend until it closes back above first resistance and holds there.
Oversold markets can snap higher fast, catching late sellers off guard. A slip through the floor, though, would leave no mapped level to catch the fall.
Disclaimer: This article is provided for informational purposes only. It is not offered or intended to be used as legal, tax, investment, financial, or other advice.
Disclaimer: This article is provided for informational purposes only. It is not offered or intended to be used as legal, tax, investment, financial, or other advice.
Related Stories