ETH Down 30% This Year as Hot CPI Revives Rate Hike Bets Across Crypto
 Alex Carter

Three Things to Know
- Hotter-than-expected US inflation data revived rate hike bets and pulled major cryptocurrencies lower together.
- Ethereum trades under a tight band of moving averages that has capped every recent rally attempt.
- Bulls are watching one key floor, with little visible support beneath it.
Ethereum fell with the rest of the crypto market after a hot US consumer price report revived talk of another Federal Reserve rate hike. One analyst called the backdrop "horrific."
The timing hurts ETH more than most large tokens. The coin entered the week already deep in a yearly slump, and tighter money tends to hit leveraged, speculative trades first. Traders now want to know whether oversold momentum can spark a bounce before sellers test the last clear floor.
Hot CPI Print Drags Crypto Lower as Rate Hike Odds Return
Hotter-than-expected US inflation data released on Nov 10 pushed traders to price in another interest rate hike. The consumer price index came in above forecasts, and that cut demand for risky assets across markets. Crypto took the hit the next day.
Bitcoin, Ethereum, XRP and Dogecoin all fell together. Bitcoin slipped below $73,500, while XRP traded near $1.05. One market analyst described the setup as "horrific," pointing to the risk that the Federal Reserve keeps tightening.
Higher rates make cash and bonds more attractive. They also raise borrowing costs for traders who use leverage. Speculative assets like crypto tend to suffer first when money gets tighter.
ETH has felt that pressure more than most large coins. It is down about 30.6% year to date, one of the weakest showings among major tokens in 2026. The latest inflation surprise added fresh weight to a market that was already struggling to find buyers.
Ethereum Trades Beneath a Ceiling of Moving Averages
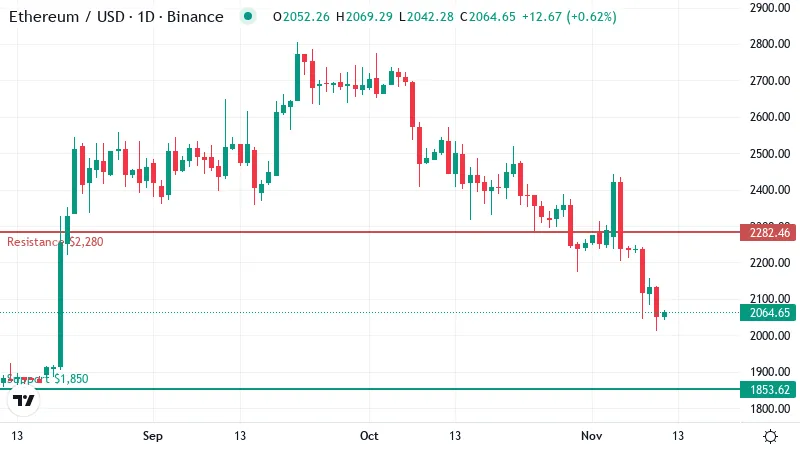
Ethereum changed hands near $2,060 on Wednesday, roughly flat over the past 24 hours. The calm session hides a rough stretch. ETH has lost about 9% over the past week and about 19% over the past month.
That slide began well before the inflation report, as buyers stepped back for weeks.
Two moving averages now sit just above the price. A moving average smooths out daily swings to show the broader direction. The 50-day average stands near $2,350. The 200-day average sits just below it, around $2,310.
Those two lines are bunched closely together. That creates a thick band of overhead resistance. When price trades below both averages, they tend to act as a ceiling. Traders who bought higher often sell into any rally that reaches them.
A trend-strength gauge confirms that sellers are in charge. Short bounces have met fresh selling, with no follow-through buying.
ETH would need to climb back above the averages and hold there to change that picture. Until then, the path points sideways to lower.
Sellers Still Hold the Momentum Edge
RSI, a 0 to 100 gauge of momentum, reads 31 on the daily chart. That puts ETH just above the oversold line at 30. Readings this low show selling has been heavy and fast.
Oversold conditions often spark short relief bounces. Sellers run out of fuel, and bargain hunters step in for a few sessions. Still, a low RSI alone does not mark a bottom. Coins can stay oversold for weeks in a strong downtrend.
The MACD, another momentum tool, sits below its signal line. That means downward momentum has not faded yet. Bears still have the upper hand on this measure.
Wednesday's quiet session offers a small hint of exhaustion after a punishing week. Buyers need more than one calm day, though. They need higher closes on rising volume to prove the selling has ended.
$1,850 Is the Floor Bulls Cannot Lose
Support sits near $1,850 on the daily chart. Buyers have defended this zone before, and it marks the last clear floor. A close beneath it could open the door to a fast slide, with little to catch the price.
Overhead, the first hurdle stands near $2,280. That level sits just under the band of moving averages. Reclaiming it would ease the pressure and show buyers can win back lost ground. It would also put the averages within reach for a test.
The bigger test comes near $2,400. A push through that mark would lift ETH back above both averages. Those lines would then flip from ceiling to floor. That shift would change the trend picture and weaken the case for sellers.
What the Next Three Days Could Bring
Rate expectations will likely decide which way ETH breaks over the next three sessions.
- Bullish: Oversold conditions spark a relief bounce that carries ETH above the first hurdle under the moving averages. Buyers would then aim for the upper resistance, where both averages could flip into support. A close back below this week's lows would void that setup.
- Bearish: Traders price in more rate hikes, and ETH slides to test the support floor. A daily close beneath it leaves no clear level below. Reclaiming the first hurdle would cancel this view.
Macro Keeps the Pressure on Ethereum
Ethereum remains in a downtrend run by sellers. Many traders will keep selling rallies until the price holds above its moving averages.
Macro news carries the biggest risk. Another hot inflation reading or hawkish comments from Fed officials could knock ETH through its floor quickly.
Disclaimer: This article is provided for informational purposes only. It is not offered or intended to be used as legal, tax, investment, financial, or other advice.
Disclaimer: This article is provided for informational purposes only. It is not offered or intended to be used as legal, tax, investment, financial, or other advice.
Related Stories