Dogecoin Price Could Drop to $0.04 if $0.059 Gives Way
 Alex Carter

Three Things to Know
- Dogecoin has fallen out of the top 10 cryptocurrencies as spot sellers and idle ETFs drain demand.
- Daily momentum looks deeply oversold, yet trend gauges still show sellers firmly in control.
- Everything hinges on whether buyers can hold the support zone DOGE is testing right now.
Dogecoin has slid deep into a falling channel, and the chart suggests the memecoin could lose much more ground. Price now sits right on the support zone that analysts flagged as the last line before a deeper drop.
The timing matters for DOGE holders. Fund flows have stalled, leveraged longs sit underwater and liquidation clusters wait below. Traders now face one question: can a small daily bounce turn into a real defense of this floor?
Dogecoin Slides Out of the Top 10 as Buyers Walk Away
Dogecoin has lost more than 40% since Sept 22, and the slide has pushed it out of the top 10 cryptocurrencies by market value. Its market cap now sits near $9.88 billion.
Spot trading shows who is in control. On Binance, net volume tilted toward sellers by about 265.5 million DOGE. Chaikin Money Flow, a gauge of whether money is entering or leaving an asset, fell from 0.20 to 0.01. That drop suggests capital is quietly heading for the exit.
Institutional demand has gone quiet too. The two US Dogecoin ETFs have recorded no activity for a month, according to SoSoValue data. Their last move came on Oct 13, a small net outflow. Cumulative inflows over a full year total only about $15 million.
Leveraged traders are feeling the strain. Long positions on Hyperliquid carry an average entry near $0.0842, leaving them deep underwater. Alphractal data shows large clusters of long liquidations at $0.061 and $0.03, levels that could speed up any further drop.
DOGE Trades Far Below Both Long Averages
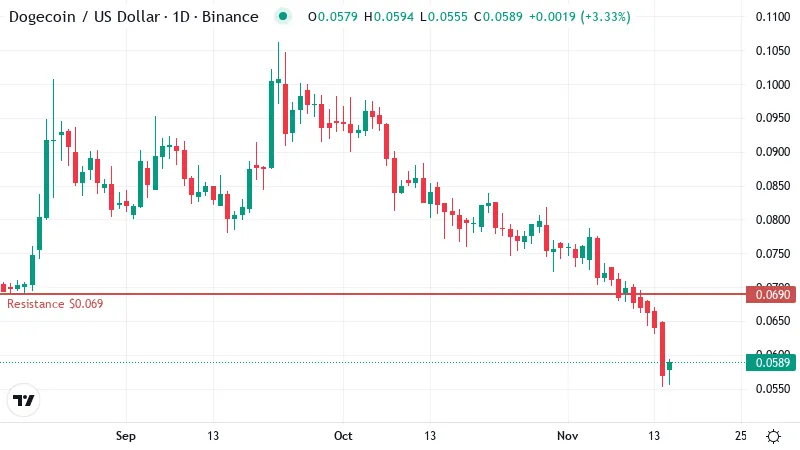
Dogecoin now trades near $0.059, right inside the zone flagged as key support. Buyers have little room left to defend.
The 50-day moving average, which tracks the average closing price over roughly two months, sits near $0.076. DOGE trades well beneath it, so that level now acts as a ceiling rather than a floor.
Further out, the 200-day average stands around $0.088, far above the current price. When a coin trades below both long averages, the broader trend points down, and rallies tend to meet sellers on the way up.
Recent losses show how steady the decline has been. DOGE fell about 17% over the past week. Over the past month, the drop reaches roughly 28%. Those figures fit the descending channel visible on the daily chart, where each bounce has peaked lower than the one before.
The coin did gain about 3% in the last 24 hours. One green day inside a falling channel does not change its direction. For now, the bounce reads as a breather, and sellers still set the pace.
Oversold, Yet Sellers Still Hold the Wheel
The daily RSI, a 0 to 100 gauge of momentum, sits at 24. Any reading below 30 counts as oversold. DOGE has fallen so far, so fast, that sellers may be running short of fuel.
Oversold coins often stage short relief bounces. Traders who shorted the slide take profits, and bargain hunters step in for a quick trade. Those moves can be sharp, but they tend to fade without fresh demand behind them.
Other signals argue for caution. The MACD, which compares short and longer price trends, remains below its signal line, so momentum is still pointing down. Trend strength readings also confirm a real downtrend.
An oversold reading can stay in place for weeks during a strong decline. DOGE may bounce from here, but the indicators do not yet show that a bottom has formed.
With No Floor Charted, $0.04 Comes Into View
The daily chart shows no support line below the current price. Earlier selling left no clear shelf where buyers have gathered.
If the current zone gives way, the next buyer zone sits near $0.04. Reaching it would mean another steep leg lower for a coin already under heavy pressure.
The upside path is better mapped. Resistance stands near $0.069, the first hurdle for any relief rally. A close above it on the daily chart would open the way toward $0.075.
That second level sits close to the channel's mid-range near $0.074. Reclaiming it would bring DOGE back toward its 50-day area. Bulls would then face a stiffer test against that ceiling.
Two Roads From the $0.059 Line
DOGE now faces a simple fork at its current level.
- Bullish: Buyers defend the present zone and push price above first resistance. That would open a run toward the second hurdle near the channel's mid-range. The case fails if price slips back below today's line.
- Bearish: A daily close under the current level confirms the breakdown. Price has already passed the first liquidation cluster, so forced selling could carry DOGE toward the lower buyer zone. The case fails if price reclaims first resistance.
A Coin Hanging by One Level
DOGE looks stretched to the downside, yet the trend still belongs to sellers. Any bounce from here deserves suspicion until price clears first resistance.
The bigger risk sits below. Fund demand has dried up, and the chart shows no floor under the current line. If buyers step away, a breakdown could unfold quickly, with liquidations adding fuel.
Disclaimer: This article is provided for informational purposes only. It is not offered or intended to be used as legal, tax, investment, financial, or other advice.
Disclaimer: This article is provided for informational purposes only. It is not offered or intended to be used as legal, tax, investment, financial, or other advice.
Related Stories