Chartist's 1,100% Avalanche Call Faces a Detour as AVAX May Dip Toward $7 First
 Alex Carter

At a Glance
- Analyst Javon Marks says Avalanche could rally more than 1,100% from here.
- AVAX still trades under its bunched 50-day and 200-day averages, though momentum has started to turn up.
- A break of nearby support could send the token toward $7 before any long rally gets going.
Crypto analyst Javon Marks has put a twelvefold target on Avalanche, based on the token's long-term chart pattern.
The forecast lands after a month of steady losses for AVAX, with buyers yet to retake the trend. Traders now want to know whether the token can hold its nearest floor before a deeper dip.
Javon Marks Bets on a Twelvefold Avalanche Run
Marks expects a major breakout in Avalanche. He did not attach a time frame or any conditions to the call.
Marks bases the view on the token's long-term chart structure. He describes a "potential" run higher and relies on price history alone. He did not cite network data or new catalysts.
AVAX trades near $8.28, so the target points to roughly $99. That would take the token back to levels it has not seen in years.
The nearer test sits below the current price. A slide toward $7 would weaken the bullish structure Marks describes.
AVAX Trades Under a Ceiling of Twin Averages
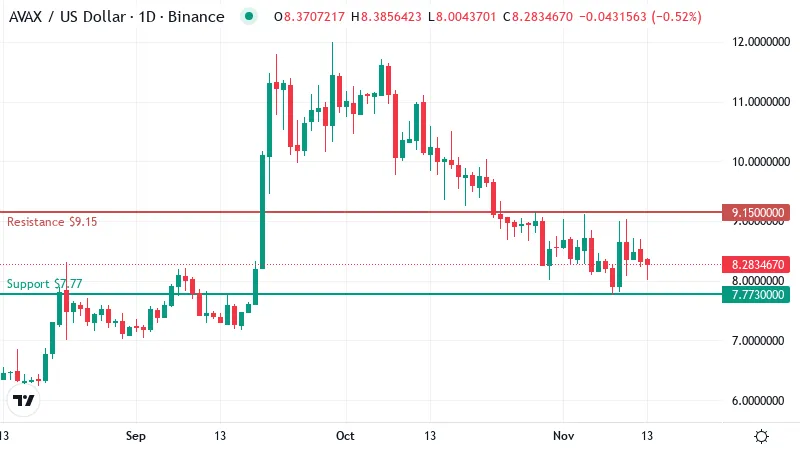
AVAX remains under both of its key moving averages. The 50-day average, which tracks the past ten weeks of prices, sits near $8.94. The 200-day average, a gauge of the longer trend, is close by at about $9.01. With the two lines so tightly bunched, they act as a single ceiling above the price.
That band matters for anyone weighing a large rally. Sellers have stepped in each time the token approached it in recent weeks. Until buyers push the price back above both lines, the broader trend still points lower.
AVAX lost about 19% over the past month, a steady slide that pulled it well under the averages. The token gained about 1% this week and has been flat over the last day.
The selling has eased, but buyers have not taken control yet.
Momentum Turns Up While Strength Stays Absent
The daily RSI, a 0 to 100 gauge of momentum, reads about 42. That puts AVAX in weak territory. Sellers hold a slight edge, and the reading leaves room for a move in either direction.
Momentum has started to improve. The MACD, which compares short and longer price averages, has crossed above its signal line. That shift suggests the selling pressure of the past month is fading.
Trend strength tells a quieter story. The data shows no strong trend in place, up or down. For now, AVAX looks more likely to drift sideways inside a range than to break out sharply.
Where Bulls Must Defend and Where Bears Stall
The first line of defense sits near $7.77, the nearest support on the daily chart. Buyers have held that zone through the recent pause. A daily close below it would open the path toward the next support around $7.05.
Overhead, the nearest resistance stands near $9.15, just above the twin averages. A close above that level would flip the short-term picture in favor of buyers.
The next hurdle sits around $9.76. Clearing it would mark a broader recovery from the monthly slide.
Two Roads for the Next Three Days
- Bullish: A daily close above the nearest resistance would put AVAX back over its twin averages and aim it at the next hurdle. Improving momentum would support that push. The setup fails if the token slips back under its first support.
- Bearish: A break of that first support would point to the lower floor and test Marks' call early. The bearish case fails if buyers reclaim the 200-day average.
A Long Shot That Needs a Floor First
Marks' call is a long-range bet on chart structure. The live chart has not confirmed even its first leg. With no real trend in place, a deeper dip could come before any rally begins.
Disclaimer: This article is provided for informational purposes only. It is not offered or intended to be used as legal, tax, investment, financial, or other advice.
Related Stories