Can SUI Reach $1? Clearing $0.95 After a $3M Long Flush Comes First
 Alex Carter

Three Things to Know
- A wave of forced selling hit leveraged SUI buyers on Sunday, with long liquidations near $3 million in one hour.
- The token still trades under both its 50-day and 200-day averages, and momentum keeps pointing down.
- Bulls need to reclaim the $0.95 ceiling before any talk of a round-number target makes sense.
Sui's token fell sharply in one hour on Sunday as exchanges closed out leveraged long bets. Almost all of the liquidations hit buyers.
The flush matters because SUI was already sliding for weeks, and dip buyers misread the bottom. Leverage has now thinned, which can steady prices for a while. Traders want to know if that calm becomes a real recovery or simply a pause before another leg lower.
A $3 Million Long Flush Knocks SUI Below $0.82
Sui's token dropped about 3.3% in one hour late on Sunday, Nov. 8. On Binance's SUI/USDT pair it fell from near $0.847 to around $0.820. The slide left SUI down roughly 3.8% over 24 hours at that point.
Leverage did most of the damage. Long liquidations across Binance, Bybit and OKX reached about $3.04 million in that single hour. Short liquidations came to only $20,000.
That lopsided split tells a clear story. Traders had piled into leveraged bets on a bounce, and the drop forced exchanges to close those positions. Each forced sale added more selling pressure on the way down.
The flush also shows that dip buyers had stretched too far. Sui ranks 29th by market value, at roughly $3.47 billion.
Sellers Keep SUI Pinned Under Both Key Averages
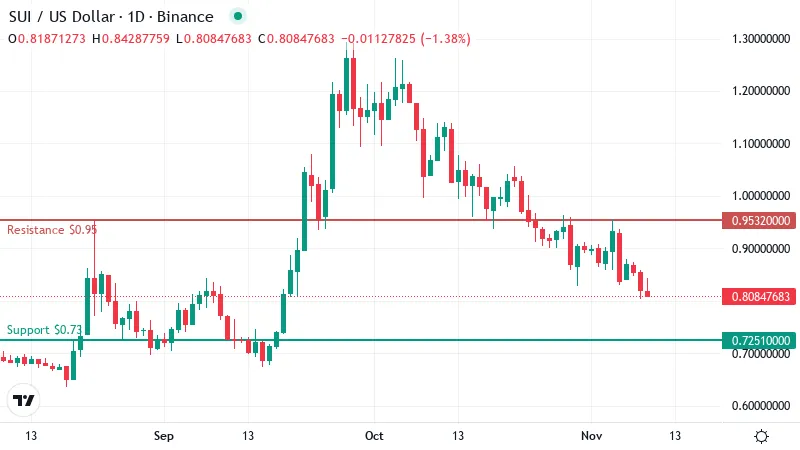
SUI now trades near $0.81, and the broader chart explains why that flush hit so hard. The token sits below its 50-day moving average, a running average of closing prices, which stands around $0.93. It also trails its 200-day average near $0.97.
Both averages sit overhead, and that matters for anyone hoping for a quick rebound. A price below these lines usually means they act as ceilings, where rallies stall and sellers step back in. The shorter average also sits below the longer one, a classic downtrend structure.
Sunday's drop did not start this decline. SUI has lost about 24% over the past month and roughly 10% over the past week. Leveraged buyers were betting on a turn that the trend never confirmed.
The past day looks calmer. SUI slipped only about 1% over 24 hours, a modest move after the violent hour that came before it. That suggests most of the forced selling has already run its course.
Sellers still hold the trend, and the price has yet to show it can climb back toward either average.
Momentum Leans Weak With Room to Fall
The daily RSI, a 0 to 100 gauge of momentum, sits near 36. That reading counts as weak, so buyers have lost steam. It still sits above 30, the line that marks oversold conditions.
In practice, SUI has not yet sold off hard enough to invite the usual bargain hunters. The token could slide further before momentum gauges flash a stretched reading.
The MACD, which tracks shifts in momentum, remains below its signal line, so momentum is still pointing down. Trend strength readings show sellers driving a real trend.
None of these gauges hints at a turn yet. A reversal would first need momentum to flatten and buyers to take back control of the trend.
Where Support and Resistance Decide the Next Leg
On the daily chart, the nearest floor sits around $0.73. That level marks where buyers last showed real interest. A clean break below it would leave little support until roughly $0.64.
Such a drop would carry SUI into territory it has not tested in this slide. With momentum still weak, a breakdown could draw in fresh selling and more forced exits from leveraged longs.
Overhead, the first ceiling stands near $0.95, the level bulls need most. Reclaiming it would lift the price back above both moving averages at once. That shift would mark the first sign that buyers have wrested the trend from sellers.
A close above that ceiling would also open the path toward the next resistance near $1.06. The $1 mark sits just inside that range, so it would come into view only after the breakout holds.
Two Paths for SUI Over the Next Three Days
- Bullish: A daily close above the first ceiling would put the next resistance in play, with a test of the round-number mark along the way. The case fails if SUI drops back under its 50-day average, which would turn that line into a lid again.
- Bearish: A break of the nearest floor would point toward the lower support zone, where longs could get flushed again. A recovery above $0.85 would cancel this view and suggest sellers are tiring.
The $1 Dream Waits on a Reclaimed Ceiling
For now, the round-number target looks out of reach. SUI first has to win back that overhead ceiling, and until it does, the bias stays bearish.
Traders should still expect jolts. Leverage has thinned after Sunday's flush, and thin positioning can flip quickly. Sharp squeezes in either direction remain likely, so tight risk limits matter more than bold calls.
Disclaimer: This article is provided for informational purposes only. It is not offered or intended to be used as legal, tax, investment, financial, or other advice.
Disclaimer: This article is provided for informational purposes only. It is not offered or intended to be used as legal, tax, investment, financial, or other advice.
Related Stories