Can Bitcoin Really Reach $100K? A Wall Street Bank's Trimmed Call Meets the Chart
 Alex Carter

Citi has lowered its Bitcoin price target in a fresh research note. The bank also cut its outlook for Ethereum.
The downgrade lands after a sharp monthly slide. Even so, the new target sits far above today's price. Traders now face one question. Can buyers stop the selling before the bank's reduced forecast drifts out of view?
Citi Lowers the Bar to $99,532
Citi, one of the largest US banks, has cut its Bitcoin price target to $99,532. The bank set out the new number in a research note. The figure replaces an earlier, higher target, so the move counts as a downgrade.
Ethereum took a cut too. Citi lowered its target for the second-largest coin to $2,838. Together the two cuts point to a cooler view of the crypto market as a whole.
Several details remain unclear. The note as reported gives no time frame for the target and no conditions attached to it. They also do not spell out the bank's full reasoning for the reduction.
That makes the call only mildly bearish. Citi marked its outlook down, which signals less confidence than before. Yet the new target still sits well above where Bitcoin trades today. Readers can treat it as a lowered ceiling and still see a forecast for higher prices.
A 58% Climb After a 23% Drop
Bitcoin traded near $63,000 on the day, flat over 24 hours. From there, Citi's target requires a gain of about 58%. That is a large climb for any asset.
The recent pace runs the other way. Bitcoin lost about 15% in the past week and roughly 23% over the past month. Selling has sped up lately.
Such a reversal would take two steps. Bitcoin would first have to win back its monthly losses. Then it would need to keep rising well past that point.
What Has to Go Right
First, the selling has to run out of steam. Several conditions need to line up before Citi's target comes into view.
- Sellers: They need to tire. RSI, a 0 to 100 gauge of momentum, sits near 20, deep in oversold territory. Readings this low often come before bounces. They guarantee nothing.
- Momentum traders: They want the MACD to cross back above its signal line. For now, momentum is still pointing down.
- Buyers: They must retake the 50-day average near $75K and the 200-day average just above it. Both lines sit overhead and act as a ceiling.
- Trend followers: Sellers lead the current trend. That leadership has to pass to buyers.
$75K Is the First Proof Point
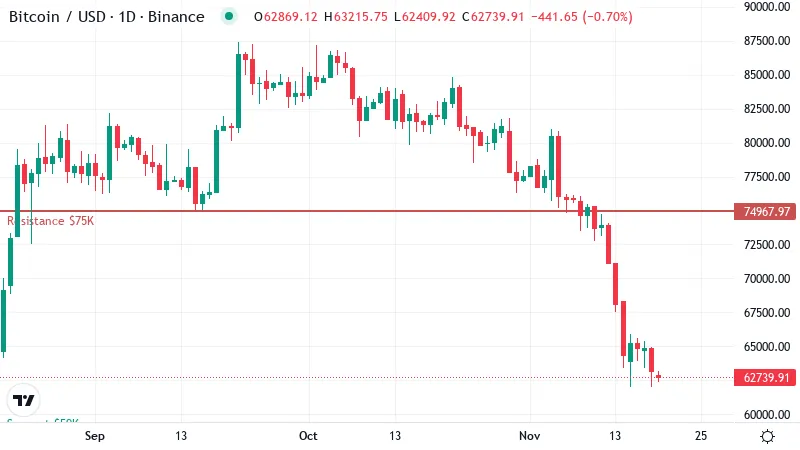
On the daily chart, the first test sits at the red resistance line, the same level where the 50-day average now runs. A daily close back above that zone would be the earliest sign that Citi's call is on track. It would show buyers can absorb the selling that has driven the slide.
One close would not settle it. Buyers would need to hold that level for several sessions and turn the old ceiling into a floor. The 200-day average sits just above, so the two lines form one thick band of overhead supply.
If that band gives way, the next resistance waits near $80K. Clearing it would open a path toward the high $90Ks, where Citi's target lives.
For now, the chart still describes a downtrend. Bitcoin trades below both averages, and each rally so far has met sellers. Until price closes above that first barrier, the path of least resistance points lower.
Where the Call Breaks
The green support line near $59K marks where the call could break. A daily close below it would leave no marked floor underneath. That would push Citi's target much further out of reach.
Over the coming weeks, a close above both averages would support the bullish path. Without it, the call stays in doubt.
Disclaimer: This article is provided for informational purposes only. It is not offered or intended to be used as legal, tax, investment, financial, or other advice.
Disclaimer: This article is provided for informational purposes only. It is not offered or intended to be used as legal, tax, investment, financial, or other advice.
Related Stories