BTC Rejection at $80,000 Strengthens Case for a Drop to $65,000
 Alex Carter

Three Things to Know
- Bitcoin erased its entire post-midterm rebound as US stocks sold off and Washington's crypto bill stalled.
- The election spike died at the 50-day average, and price now leans on the slower long-term trend line.
- Traders are watching whether a lower floor near $65,000 comes into play if the 200-day line breaks.
Bitcoin reversed sharply on Thursday, wiping out the gains it made after Democrats took both chambers of Congress. Crypto stocks fell harder than the broader market, and a key market structure bill now looks stalled until next year.
The reversal leaves Bitcoin sitting on its last major trend line, with sellers controlling momentum. Traders now want to know whether buyers can defend this level.
Midterm Rally Unravels as Clarity Act Hopes Fade
Bitcoin gave back its entire post-election bounce on Thursday. The largest cryptocurrency fell about 5% and traded near $75,433 late in the session. On Wednesday it had climbed above $80,000 after Democrats swept both chambers of Congress in the midterms.
The drop came as US stocks sold off broadly. Crypto-linked shares took heavier losses, with Coinbase, Robinhood, Strategy and Bullish each down 9% or more. Total crypto market value dropped by roughly $370 billion.
Policy hopes faded fast. Brian Gardner of Stifel said the Clarity Act is "off the table for the lame duck session." He put the odds of a bipartisan deal in the next Congress as "pretty low." He also expects Sen. Elizabeth Warren to pursue crypto probes. She is the likely Senate Banking chair.
Fundstrat's Sean Farrell offered a brighter view. He said a Democratic win could lift Bitcoin's appeal as a hedge against bigger federal deficits.
Research firm K33 had warned earlier in the week that thin trading and rising leverage left Bitcoin exposed to sharp swings. The market also remains fragile after last week's $6.3 billion Binance hack.
The 50-Day Average Turned the Election Pop Away
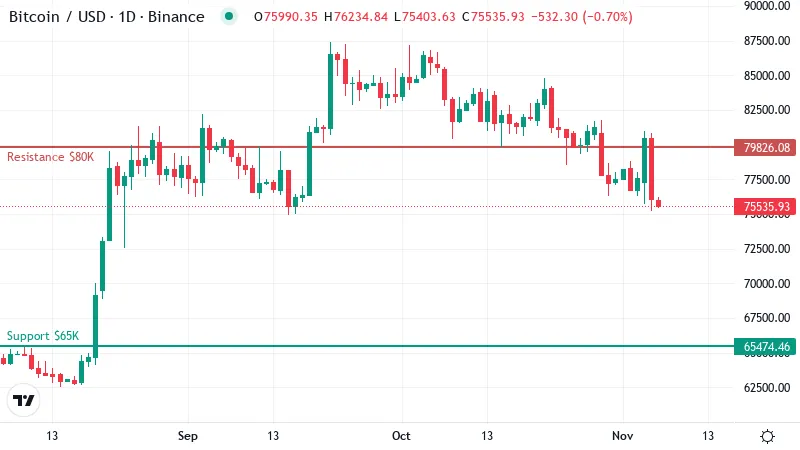
Wednesday's spike ran straight into the 50-day moving average and stopped there. That average tracks Bitcoin's mean closing price over the past 50 sessions, and it sat right at the round number buyers briefly cleared. The failure confirmed the line as a ceiling. Sellers who had waited for a test of that level used the rally to exit.
The pullback has now dropped price onto a second, slower line. The 200-day average, which traders use to judge the long-term trend, sits near $76K. Bitcoin trades at almost exactly that level, and the past 24 hours left it flat.
Below it, the daily chart shows open space. A clean break would put Bitcoin under both of its major averages at once. Traders usually read that setup as a downtrend in which rallies get sold.
The bigger picture shows why the election pop never had much footing. Bitcoin is down about 3% over the past week and roughly 12% over the past month.
In other words, the midterm bounce was a short counter-move inside a decline that started weeks earlier. It lifted price toward resistance without changing the direction of the trend. Buyers lacked the conviction to hold gains once policy news soured and stocks weakened.
Sellers Still Hold the Momentum Edge
Momentum gauges back up what the price action shows. The daily RSI, a 0 to 100 measure of buying and selling pressure, sits near 38. That reading is weak, but it is still well above the oversold zone below 30. In plain terms, sellers have room to push further before the market looks stretched enough to invite bargain hunters.
The MACD, which compares short- and long-term price trends, remains below its signal line. That means momentum is still pointing down. Wednesday's bounce was too brief to flip it.
A separate trend-strength gauge shows a trend starting to form, with sellers in control. The move lower is gaining structure. The failed rally left the bearish setup intact.
Why $65,000 Is the Next Real Floor
Below the 200-day average, the daily chart shows little in the way of support until $65K. A drop to that floor would extend Bitcoin's slide by roughly another 14% from current prices.
The gap matters because markets tend to move quickly through empty zones. With few buyers waiting in between, a break of the long-term line could turn into a fast slide rather than a slow grind.
Just beneath sits $63K, close enough to form one band of support with it. Losing it would raise the risk of a deeper flush. The leverage K33 flagged could force liquidations, as traders with borrowed money get pushed out of their positions.
To undo the damage, bulls would need to reclaim the 50-day line and then clear $82K.
Two Paths Decided Around the 200-Day Line
Where Bitcoin closes relative to the 200-day average will likely decide which path plays out.
- Bullish: If buyers defend the 200-day average and close back above $80K, the 50-day line flips from ceiling to floor. That would open a run toward the next resistance band. A close below the 200-day line would cancel this view.
- Bearish: A daily close under the 200-day average would hand sellers control. The first target would be the support zone flagged above, followed by the cushion just beneath it. A reclaim of $80K would invalidate this outlook.
Bears Keep the Upper Hand for Now
Until buyers win back the 50-day line, the easiest route still points toward the lower floor.
Thin order books and heavy leverage can still trigger sudden squeezes in either direction. Fresh headlines from Washington on crypto oversight could spark them.
Disclaimer: This article is provided for informational purposes only. It is not offered or intended to be used as legal, tax, investment, financial, or other advice.
Disclaimer: This article is provided for informational purposes only. It is not offered or intended to be used as legal, tax, investment, financial, or other advice.
Related Stories