BTC Funds Draw a Net $4B in Q3, Ending Nine Months of Institutional Selling
 Alex Carter

Three Things to Know
- Institutional investors turned net buyers of bitcoin funds in the third quarter after three straight quarters of selling.
- The daily chart shows bitcoin deeply oversold, yet sellers still control momentum.
- One nearby support level now stands between bitcoin and open air below.
Big investors bought a net $4 billion of bitcoin funds in the third quarter. The buying ended nine months of steady selling by the same group.
The timing makes the figure awkward for bulls. Bitcoin has slid hard since the quarter closed, and that summer demand has not stopped the drop. Traders now want to know whether those buyers will step back in at lower prices.
Institutions Return With $4 Billion After Nine Months Away
The quarterly inflow marks a clear change in behavior. Large holders had been net sellers for the previous nine months, steadily trimming their exposure through the first half of the year.
The reversal suggests professional money saw value at summer prices. Funds that had been heading for the exit started adding again. For a market that leans on big buyers to absorb supply, that shift carries weight.
Details remain thin. Only the headline figures from the report are available, with no breakdown by fund, issuer or investor type. Readers should treat the total as a broad snapshot of direction.
Timing matters too, since the data covers July through September. It says nothing about how institutions have behaved during the steep November sell-off, which began weeks after the quarter closed.
Bitcoin Trades Far Beneath a Shared $75K Average
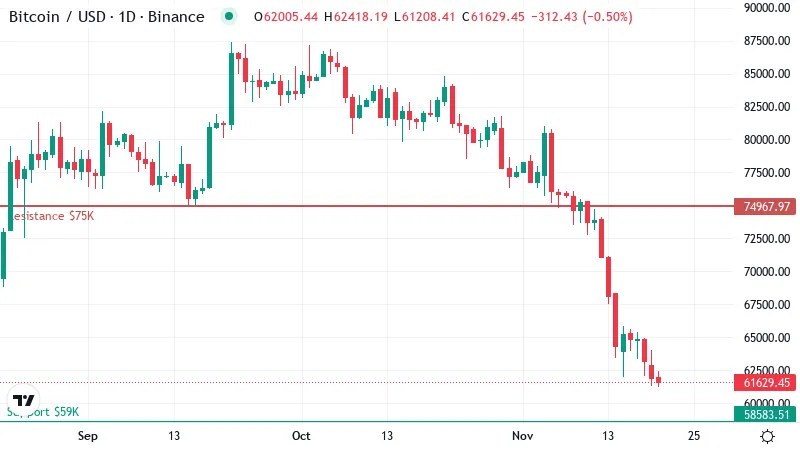
Bitcoin traded near $62,000 on Thursday, well below the levels that defined its recent trend. Both the 50-day and 200-day moving averages now sit around $75,000. A moving average smooths out daily swings to show the typical price over a set period. When price trades below it, that average tends to act as a ceiling.
The two averages have drifted together, which is unusual. The 50-day line tracks the short-term mood, while the 200-day line reflects the longer trend. Their convergence means recent gains have been erased, and the short-term picture has sunk to meet the long-term one. Bitcoin now sits roughly 17% under both, a wide gap that buyers would need to close before the trend could repair.
Over the past month, bitcoin has lost about 26%. Whatever demand returned over the summer has been overwhelmed by fresh selling since October.
Prices held roughly flat over the last 24 hours, a pause after the slide. A single quiet session after a sharp drop often reflects tired sellers rather than eager buyers. Nothing yet marks a turn higher, and the price sits closer to its floor than its ceiling.
Sellers Still Steer Despite Extreme Oversold Readings
RSI, a 0 to 100 gauge of momentum, stands near 19 on the daily chart. Readings below 30 count as oversold, so this one sits deep in that zone. Selling has run far and fast, and stretched markets often snap back briefly.
An oversold reading only flags exhaustion, though. It does not mark a bottom by itself. Prices can stay oversold for days when a trend is strong.
Momentum still points down, with the MACD gauge holding below its signal line. Trend-strength readings also confirm a real downtrend, and sellers are the ones driving it. Together, those signals say the pressure has not eased yet.
The weekly move shows the same picture. Bitcoin dropped about 13% over seven days, a pace that points to steady selling. Any bounce from these levels would first need to show up as a shift in momentum before it could be trusted.
Why $59K Matters More Than Any Fund Flow
Support sits near $59,000, a few thousand dollars under the current price. It is the only nearby floor, and no further support is mapped beneath it. A clean break would leave buyers without an obvious place to step in.
This is where the summer fund buying gets its real test. Institutions that added exposure in the third quarter now face losses on part of those positions. If that demand is still active, it should appear at this level. A failure to defend the level would suggest the earlier inflows have faded.
The upside map is clearer. The first ceiling matches the shared moving averages. Reclaiming that zone would put bitcoin back above both lines and turn them into support. Beyond it, resistance waits near $80,000. Both targets look distant for now.
Bounce or Breakdown in the Next 72 Hours
Two paths stand out for the coming days, and the support line decides which one plays out.
- Bullish: Buyers defend the nearby floor and the oversold reading sparks a relief rally. That bounce could carry bitcoin back toward the shared moving averages overhead. A daily close under support would cancel this view.
- Bearish: A daily close below support removes the only mapped floor and leaves open air beneath. Sellers would then keep control of the trend. A recovery above the two averages would invalidate this case.
Old Inflows Cannot Yet Outweigh Fresh Selling
The return of institutional buyers is a welcome sign from an earlier market. Sellers still control the trend, and that holds until bitcoin climbs back above its two moving averages.
Downside risk remains larger. If current support gives way, losses could gather speed quickly.
Disclaimer: This article is provided for informational purposes only. It is not offered or intended to be used as legal, tax, investment, financial, or other advice.
Disclaimer: This article is provided for informational purposes only. It is not offered or intended to be used as legal, tax, investment, financial, or other advice.
Related Stories